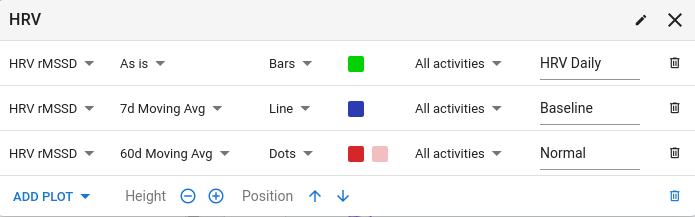
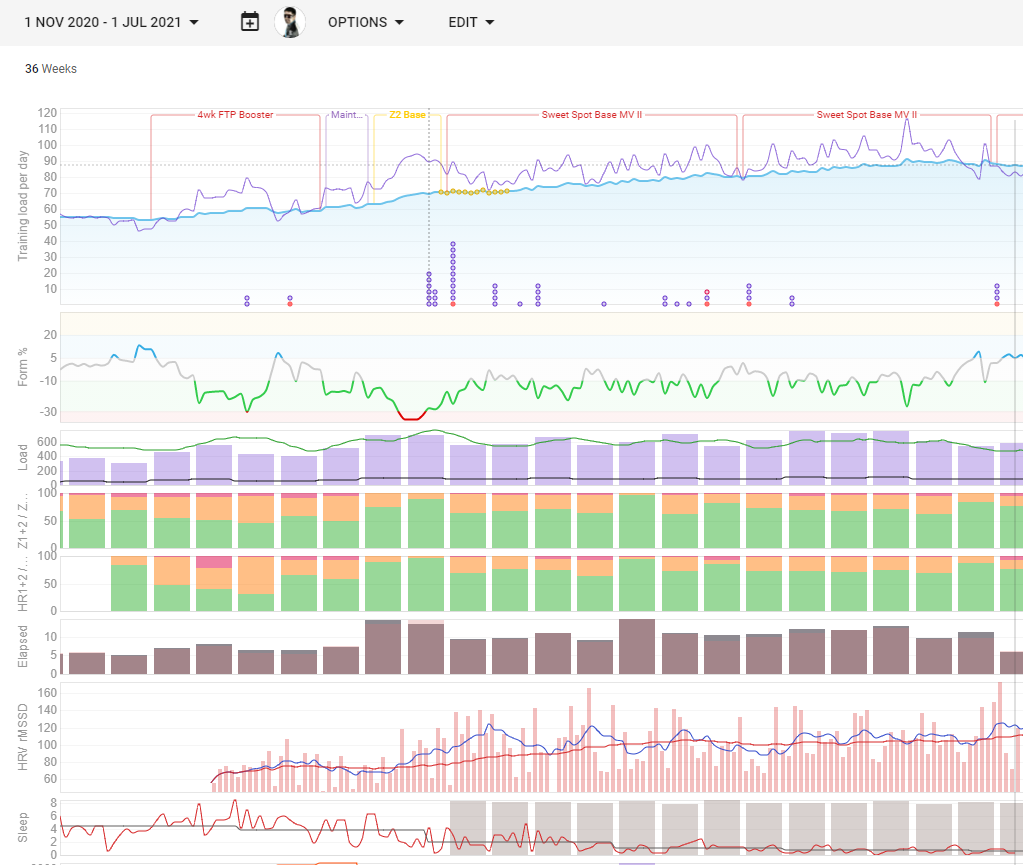
This is how it looks like in excell:
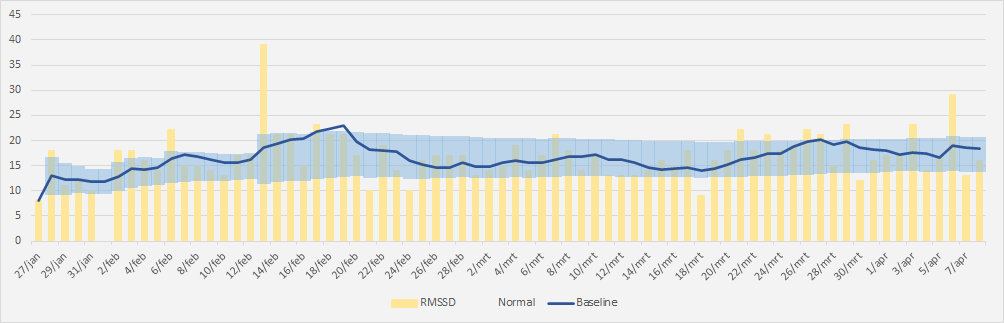
Yellow bars: daily RMSSD
Blue Line: 7day rolling avg RMSSD
Light Blue band: 60day rolling average +/- 0.75 SD
This is how it looks like in excell:
Is there a good resource for comparing the relative strengths of different HR straps for HRV measurement? (Or, how is it known that the Polar H10 is “the most accurate”?)
Polar H10 is actually the only one “validated”. There are probably other ones just as good but no comparison and/or exhaustive testing has been done. There are only a couple guys doing all this work on dfa-a1 for now. Bruce & Marco being the most implicated. @Coach_Ron uses a medical grade ECG which is the Gold standard.
Edit: There is some discussion about differences in HRM at 10:15 in this Podcast
https://x3training.com/endurance-innovation-97-bruce-rogers-with-updates-to-dfa-a1-analysis-and-garmin-metrics/
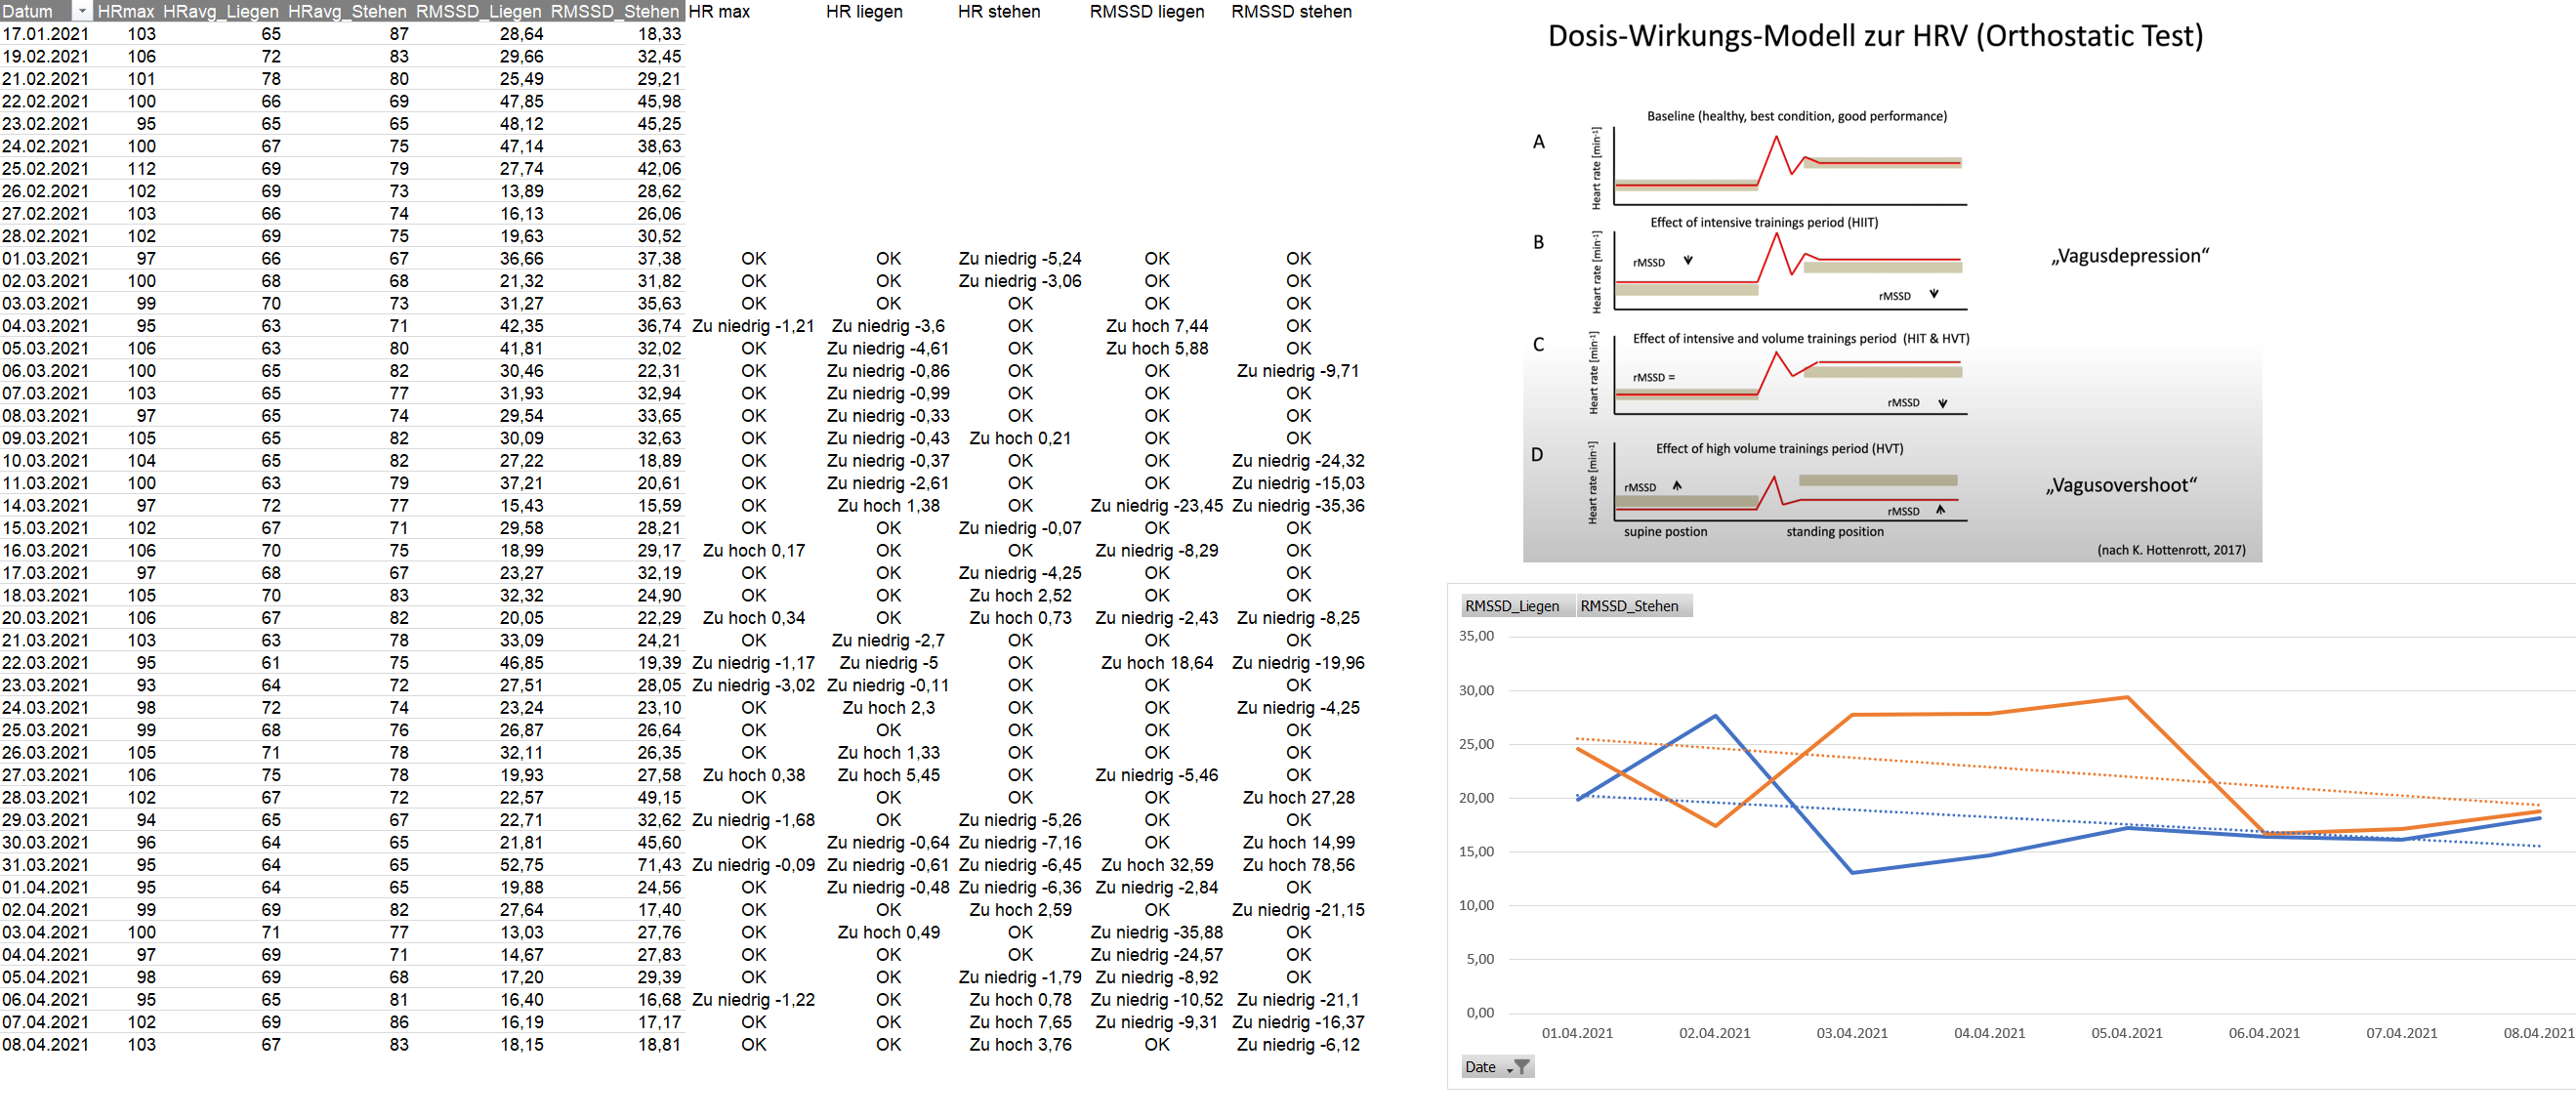
I am also playing around with HRV, but using the orthostatic test (like Polar is using it). Measurements with Polar H10 and Android App “HR Monitor” → .txt to One Drive → automatic Excel import.
The process is 2min lying, stand up, 2min standing.
Baseline 42days, window is baseline ±SD.
Sorry in German (it’s about too low or too high and the percentage as number):
Analysis is based on HRV Modell by Prof. Hottenrott. Unfortunatly I haven’t implemented no nice looking graphs yet.
My plan is a weekly CSV download of intervals to see correlations of intensity, HRV, Sleep Quality, …
BR
Stefan
Thanks for sharing @MedTechCD - I was using a different graph but your one seems a better way to track.
Some initial observations (not rocket science but nice to observe nonetheless):
Not sure if you considered log transforming rMSSD for your Excel plots. I log transform the spectral domain variables too. This appears to be superior, even for elite athletes, to account for HRV saturation. It might also decrease some of the effects of breathing frequency upon raw rMSSD values.
Your method is quite good, you’re monitoring the “adaptability” of the body in orthostatic challenge. Supine only measurements may only show one side of the coin.
Orthostatic HRV measurements is what I implement in my monitoring. But I consider 2 minutes as bit short. I go for 5 minutes minimum time window.
Imagine now if you could combine this with a couple of countermovement jumps done first thing in the morning. I never tried it but I know Polar V800 has that in its test mode. To combine these values all together in monitoring would be useful and interesting.
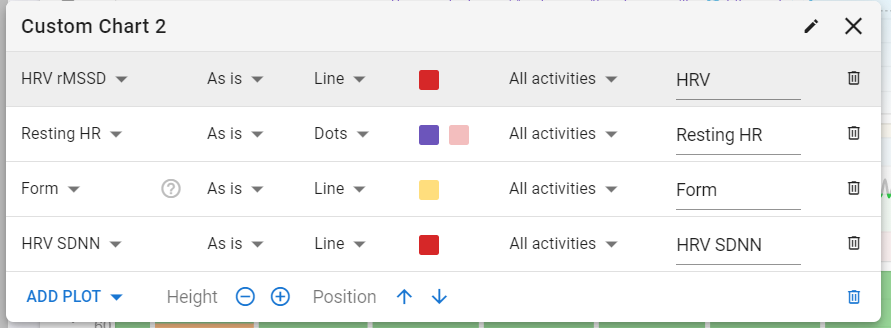
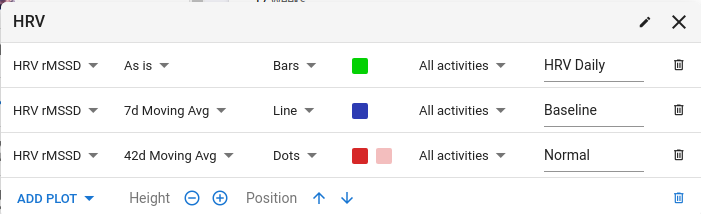
I just added that. You are doing some really neat stuff here. When this thread settles down I will add a “Resting HRV” preset chart like yours.
I’m honoured by the compliment 
But I wouldn’t be able to do this without a host. A host that puts up an app that makes every commercial alternative look like a joke. A host that is truly open-minded and very responsive. I’m taking a deep bow for all the work you’re putting in. I’m feeling like a fish in the water on this forum and all that, helps me a lot to be consistent in training.
@david When coding a preset HRV chart, it’s probably best to keep the fraction of the SD configurable (or not too “hardcoded”) because I found multiple values. The most recent value used is 0.75 but there seems to be some debate.
@Coach_Ron regarding log transformation: I will have to read up on that because I don’t like doing things that I don’t understand. I’ll have to educate myself a bit first. Looks like it does not much more then scaling the results to a handy range. Recovery points from HRV4Training and Readiness from Kubios are a scaled log transformed number from RMSSD.
@Zen_Turtle has a nice blog on the whole DFA thing …
Per diminuire gli artefatti è consigliabile collegare la Polar H10 con Bluetooth e non ant+
I created the chart. But I don’t understand how you report the HRV morning survey data? I use HRV4Training, FirstBeat and HRVElitè is it possible to pass the data automatically? if I wanted I could do the morning test also with the Garmin, I have the 745 and it foresees it
Hi,
Elite list some compatible devices here : Heart Variability Monitors and Elite HRV Compatible Monitors but what really matters is to make sure your connect using BT and not ANT+.
Hi @MedTechCD ,
Newby to the subject here.
Where at Intervals do you enter daily RMSS?
Is it a Morning Readiness reading?
thank you,
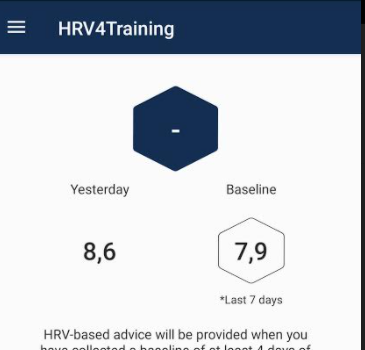
The values in the first screenshot are “Recovery points”. That’s already a log transformed and scaled value of your RMSSD. The app does that to give you a user friendly daily score. That score can only be used within the app itself because all apps have different ways of doing this (Recovery Points, Readiness, …). It’s the result of an algorithm ran on the RAW values.
In the second screenshot, you have the RAW RMSSD values. To interpret those, you need to evaluate your daily score to both the 7-day and 60-day average. I’ll try to explain a bit…
A low daily score is often fairly easy to explain by a hard training the day before, a rough night, a party with to much food and drink, … Or maybe an upcoming cold. Or a measurement problem, like reading an upsetting e-mail before your daily measurement.
If it’s a one day situation, just take it easy that day.
A downwards trending Baseline (= 7-day average), can be the result of a hard training block, training camp, several consecutive days of climbing stages… But can also be that cold that is catching on, a jetlag caused by travel or another situation causing stress that takes several days. An upward trend in Baseline is usualy seen during a recovery week.
Your Normal values (= 60-day average +/- a fraction of the standard deviation) are mostly stable unless you are experiencing a LifeStyle change. Downward trend can be caused by a long term sleeping problem, a career change involving more work stress. Upward trend might be the result of better sleeping hygiene, reduction of cafeine/alcohol.
So you need to look at all three and see if you have an explanation. If so, you now what to do.
A low daily score while the baseline is trending up and within the limits of your Normal, is probably nothing to worry about. A downwards trending baseline going beneath the lower boundary of Normal might indicate a stress situation with longer duration. An upward trending Normal simply means you have a healthier life.
All of this came from a couple of hours reading on the HRV4Training blog. There’s loads of info there. And it is very good info. I’m getting pretty good at interpreting my own results with this info and then HRV starts to really make sense.
 60days rolling avg available