It would be considered an outlier, but it’s certainly not impossible.
Did you get the 198 by historical data or did you use the 220 - age formula?
The form of the curve does not really make sure if it is an artefact or not. Do you have multiple occurrences of similar values?
Here’s a chart from an older study. The straight black line defines the 220 - age.
My first approches was 220-age but I modified by 198 bcs I saw it sometimes during my training, but If you want I can give you much more information about my HR I have a lot of data since I started to train. By the way, you can Check my ICU or my Suunto account, they are public
Same issue. When I try to set HRRc to 40 I get message “LT HR must be between 80 and 220”.
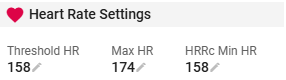
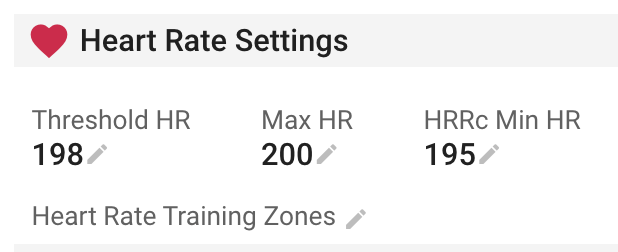
As you can see from prtscr, my Threshold HR is 158, Max HR is 174. Bur I am unable to set HRRc to 40. What should I set LTHR 158 - HRRc 40 = 118 or maybe Max HR 174 - HRRc 40 = 134?
Quite possible you’ve misunderstood the value’s intent.
The HRRc Min HR value does not mean that you set it at the HR you want the “delta” to be. It’s the threshold where the HRRc value will start counting / calculating when your HR crosses that value.
eg:
your threshold = 157
your max = 174
HRRc Min HR = 157
HRRc will trigger to start calc when your HR crosses the HRRc Min HR number, so if your workout you cross the threshold and reach a max of say 170, then it will start calc. (because you crossed 157)
but if another workout, you only reach 150bpm. In this case the HRRc won’t calc as it does not surpass the HRRc number
It must be above the value set on the settings page, to trigger the calculation.
You have to push your HR above your threshold value (zone 4) - see the chart below where HR drifts up into Z4 (158bpm).
Providing there’s 60-seconds of recorded HR, after the HR drops, after conditions 1-2 are met, it will calculate the HRRc value. This is the best HRRc value for the activity.
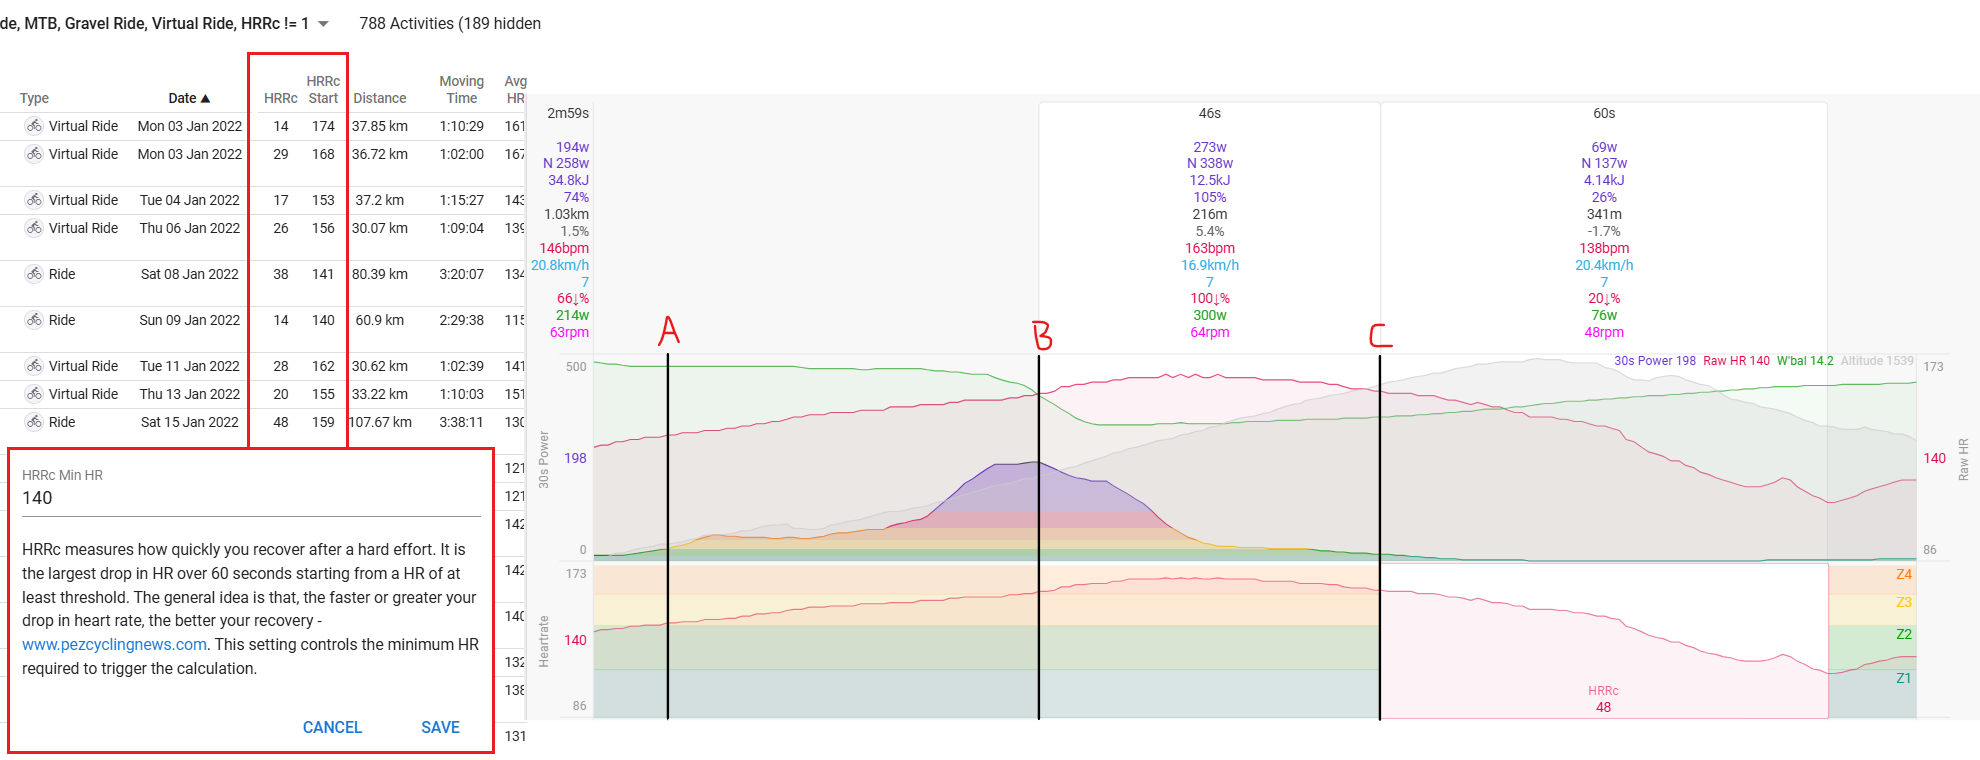
HRRc measures how quickly you recover after a hard effort. It is the largest drop in HR over 60 seconds starting from a HR of at least threshold. The general idea is that, the faster or greater your drop in heart rate, the better your recovery - www.pezcyclingnews.com. This setting controls the minimum HR required to trigger the calculation.
In my example above, my HRRc value is set to 140bpm (A), while Z4 starts at 158bpm (B). It activates the calculation at 140bpm, but only starts at 158bpm. It then records the 60-sec drop in HR as indicated by the HRRc red shaded area, providing there is no other “best” value recorded elsewhere.
For those with Garmin, not sure about other brands, they use 2-mins, but you have to keep the activity (on the watch/device) active to see their version of HRRc. Don’t stop recording your activity until 2-mins have elapsed.
I have doubts about how useful / reliable this HRRc stat can be. One reason was mentioned above: the value will differ depending on whether you are at complete rest or continue the activity at a lower effort after reaching the threshold. Also, the value will differ depending on the load leading up to reaching the threshold (HRRc will be higher if it is calculated at the start of a workout when you are still fresh as compared to calculating it at the end of a long workout when you are fatigued). In clinical settings, HRRc is generally calculated at complete rest after 1 min or 2 mins (don’t think it matters very much which one is used, as long as you stick to one) following the end of a maximal stress test (e.g. Bruce protocol). Tracking improvements in HRRc is much more reliable when it is measured in a standardised test like this. I don’t see how it will be possible to reliably track changes in HRRc over time if the variables mentioned above aren’t controlled in some way.
In my opinion, the best thing would be a HRRc estimate similar to Apple’s ‘Cardio Recovery’. Essentially, it is an estimate calculated from HHRc after an activity is stopped, and it is robust to the various levels of exertion across a users workouts. The estimate would be further improved by taking into account the activity load, and the physical position of the person after the activity is ended (e.g. standing vs sitting).
I don’t think I would ever advocate to use HRRc for every workout, and try compare it when there are so many variables. Testing is always about trying to replicate the test under similar conditions, and it doesn’t have to be lab conditions as we don’t ride/race in a lab. This specific metric is automatically detected based on meeting certain conditions, which is variable, and also adjustable, i.e. the minimum level can be set up or down.
Yep I agree with that. To clarify, I wasn’t suggesting that it can only be reliable (for purpose of comparison or tracking improvement) if it’s measured in a lab. Rather, was saying that it can only be reliable if the test always follows the same protocol and under similar conditions.
Conversely, the implemented method gives you a variable from every workout that you exceed LT heartbeat.
As a singular measure you are right, it’s pretty useless. I actually chart it out in my Fitness. As an overall trend, I think it’s helpful to correlate with how I feel overall and what my fitness is doing. It’s a bit like HRV. It can be useful information in the larger picture.
I don’t really see how it is possible to extract a trend if LT is exceeded under all kinds of different conditions that strongly influence the HRRc values. I would think you would have to look over a long time period, and the change in fitness would have to be pretty large, to see anything resembling a trend, and even then I would have doubts especially if there were any modifications to the training plan over the time period in question.
Have you seen a trend in your data that you think indicates a change (e.g. improvement) in HRRc?
I’m not using it that strongly, same as HRV. It’s an additional data point that I use to consider along with how I’m feeling. But it does have a decent correlation with how I’ve been feeling, and when it’s been lower than normal that has corresponded with high training load, and it does improve after some reduced intensity.
Am I already seeing that because of my load? Sure, but what if I dropped my load/intensity and HRRc kept going down? And my HRV was doing the same thing? It’s another metric that I think has value. And I think this is more useful than using it with an even less frequent testing regimen, which is your proposal. As a one-time measurement, in any form, it’s of almost no value, IMO.
I hate to question or doubt Intervals as it provides a good level of analysis for my needs, but does it calculate HRRc correctly?
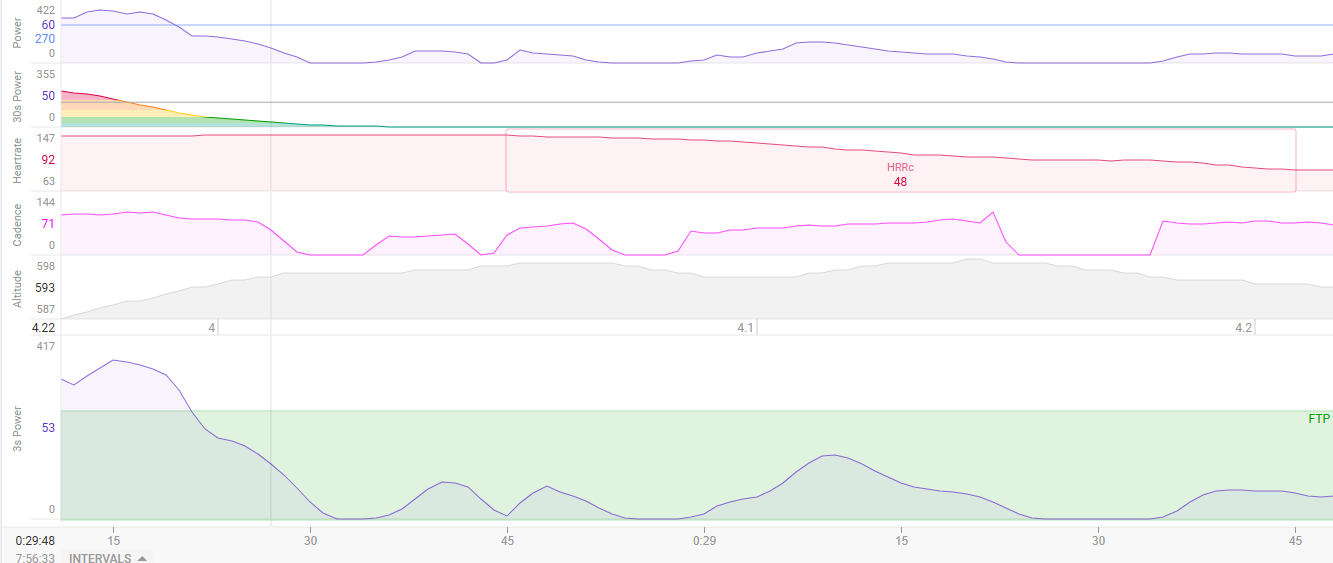
My understanding of HRRc is that it looks at the drop of HR following exercise. When I have looked at my efforts though it looks at the biggest drop of HR (assuming some thresholds have been passed). In my case my HR stays at the same rate for about 10 to 20 seconds following the end of the effort/interval. Intervals only recognises the recovery period when my HR starts to drop. So my HRRc is shown as being higher than what it really is, since the recovery period is actually 70 or 80 seconds in length. Do other apps start the recovery period at the end of the actual effort?
It counts the highest drop anywhere in the activity, providing the parameters are met. It is not the same as Garmin which is after the activity, and for 2 minutes.
There’s no general consensus for HRRc so you should not compare to other apps.
Just use it within Intervals to see if it improves or not relative to your actual results.
Thanks for confirming that my understanding of how Intervals calculates HRRc is correct. I do question whether this is correct based on definitions of HRRc that I have seen in other sources which is that you compare the HR at the end of the effort with that some time after. I don’t know about others but I have a significant delay between the end of the effort and starting to see the HR drop which is the point that Intervals uses as the first measurement of the HR