I don’t know why those are different. For an interval the average power is the average of the fixed_watts stream for the duration, with zeros included. The fixed_watts stream is created by interpolating the watts stream to 1s per tick, fixing short dropouts, filling in longer dropouts with zero, detecting and removing power spikes and then mapping it back to the original time spacing.
If you send a link to that activity I can have a closer look. You can also download a CSV of the data streams on the activity data page and poke around in Excel. The start index and end index (exclusive) of the interval index into those streams.
Unlikely that it’s with or without zeros.
I’ve look at random files in Connect and Intervals, where there would be freewheeling and it’s all the same. A CSV export into Excel shows identical data (number of lines, average Power, HR and speed).
I started poking around in Excel but I am not sure how to select the data that was recorded during the race? Start index = 951 End index = 5459. There seems to be no index numbering in the csv file.
I noticed that all my ride activities on intervals give somehow lower power values than Garmin does.
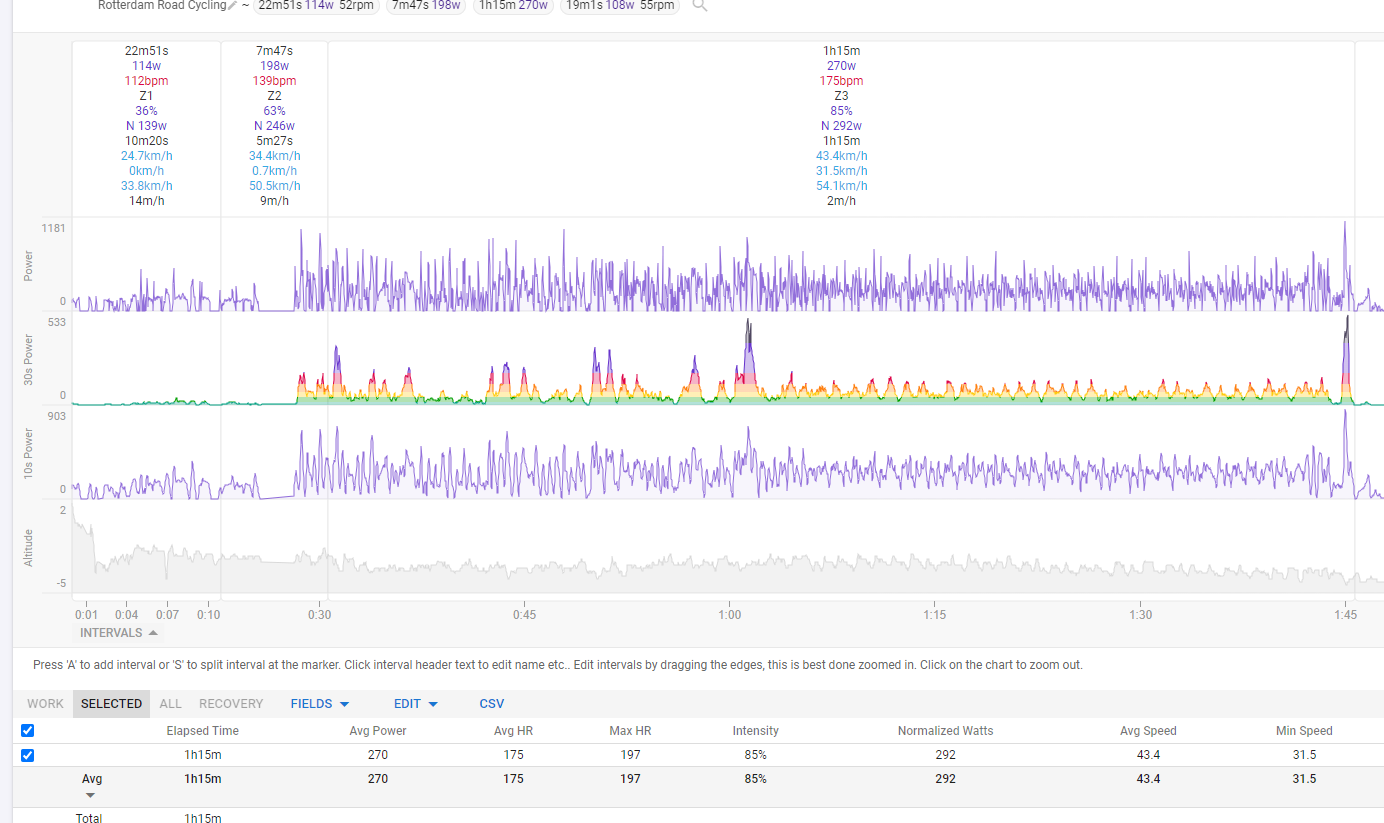
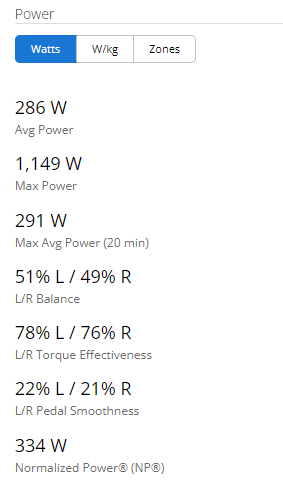
For example yesterday activity (lap button pressed once the race started, total lap time: 1h12m): 273w average and 295w normalized. While Garmin gives 288w and 309w. The Garmin values are also the same values that I saw on my bike computer during the race, therefore I tend to think the Garmin values are ok and that somehow Intervals is going funky town on the power averages.
For me Connect and INtervals always have a difference , even with Distance , but i only ride indoors with Power , so i prefer use BreakAway to record my rides, and Garmin just for “in case” ; i used before because of Moxy , but now Breakaway add Smo2 on his calculations - I still dont know what to do when i update my Garmin to use “alphaHRV” , i tried use Gotoes or fix-fitfiles to add Smo2 rides with FitFiles , w/o sucess , so when i will add DFA-1 , will be a new issue with Garmin
I have just had a look at that activity on fitfileviewer.com and using Google sheets and the streams CSV. According to the power data in the file the average for your race lap is 273w. I will DM you a link to my sheet. There aren’t any “extra” power fields. I don’t understand why such different data is being recorded for the laps. Maybe Garmin is using the power set on the indoor trainer for that?
You might want to contact their support about this.
Go to Settings and under Power section what is your Power Spikes setting? As David posted earlier, Intervals “fixes” your power data and then calculates average and normalized power. That can be one big difference between Intervals and other analytics. I’ve set my Power Spikes to 999% to effectively turn off “fixing” data that is actually good data.
This may be the reason for the difference between power shown Garmin and Intervals:
''So this gets a little complicated, but the difference is due to a couple of things going on. One is that there are radio outages that are causing some of the records to be back filled. The second is that the tools you are using to process the data are using the power values assigned to each record and are not using the accumulated power values. Using the accumulated power values is the better approach. Because of this the tools are subject to how the dropped messages are being backed filled.
The accumulated power record at the start of that #6 30 second window is 199200. The end value is 208219. That is a difference of 9019 kj. Average that over 30 seconds gives 300.63 or 301 watts. This is what the Edge reports.
The last 2 seconds on that lap and the 1st second of the next lap have the same accumulated power value because of an outage.
Using the 1 second power values that have been computed using the backfilled data because of the radio drops gives 9330 kj over 30 seconds or 311 as you get.
For the next 15 second lap the accumulated power starts and ends with 208219, 210262 or 2042 kj over 15 seconds 136.2 watts.
The sum of the individual power records gives 1720 over 15 seconds or 115’’
It seems Garmin calculates average’s using the accumulated power / time.
Here an excel file and the original fit files. The excel file excludes the auto pauze moments. I have put 3 different fit files in the sheet and the average’s calculated using the accumulated power / time are the same as Garmin.
Averages calculated by averaging the power values out of the fit file are the same as Intervals.icu.
Undoubtedly Garmin has reasons for calculating the averages this way. Curios what this reason is.
I can’t answer this question, but I would ask a question that might answer it…
Is it easier for their device software to process the accumulated power divided by duration to be able to show it on the device while you are out riding?
If I’m following the explanation, here is one very good reason:
only calculate average power from data actually collected
In other words, don’t “create” data that doesn’t exist.
Which also means don’t change the power data actually collected. Intervals “fixing” power spikes was my biggest issue when first using this really nice tool, because I can generate large spikes in power over 1-3 seconds. I’ve seen these “spikes” with all power meters I’ve used - Stages gen2 single side, Stages gen3 dual sided, SRAM Force, SRAM Red (2), Garmin 200 series pedals, and Stages stationary bikes at the gym.