No worries. I was just clarifying. If you like the 100% stack then that’s what it’s there for.
My Polar watch tracks resting HR, nocturnal HRV and sleep time. All the other metrics I input each morning. Intervals.icu makes that documentation super fast and very clear (as opposed to other platforms where I can’t for the life of me understand the logic).
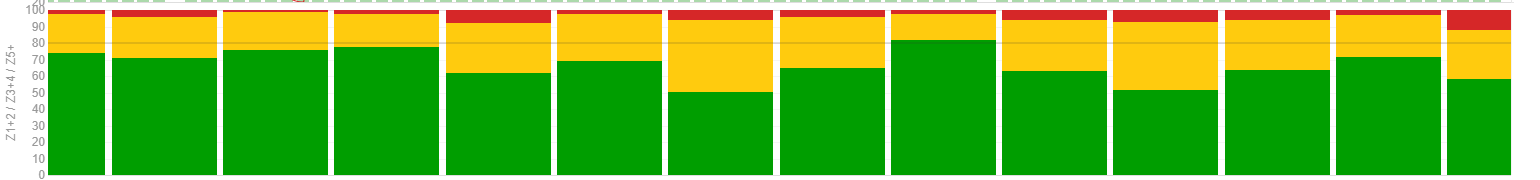
A question about this graph, can we somehow put a dark line where we want like it happens when we hover the graph? I want to have a line in the 80 value to undertstand better the 80/20 intensity
Where a person’s VT1/LT1 actually lies. IOW, the state of their metabolic health/dysfunction. It’s been shown that most people are at or near LT1 virtually at rest.
How someone has defined their zones. Traditionally in a 5 zone model, zone 3 is above VT1.
I think VT1 is more like zone 2 high and low zone 3. At least from what Inigo says in podcast, I assume that VT1, for althetes that really train everyday, could be low zone 3. But you’re right, some health diseases could lower your VT1 to almost resting or walking pace.
Clever indeed!
But does one need to set HR pre-set zones to a particular setting? Like the 80/20 or else?
(under Settings → HR settings → HR zones → Pre set)
Polarised training—either 80/20 by session OR >90% <LT1 & up to 10% >LT1 by time in zone—is a matter of schedule prescription. I use the five zone system to set my intensity zones: first by HR and then seeing what power and/or pace I deliver for each of those zones. I like to graph using three zones because that’s most reflective of physiological energy systems.
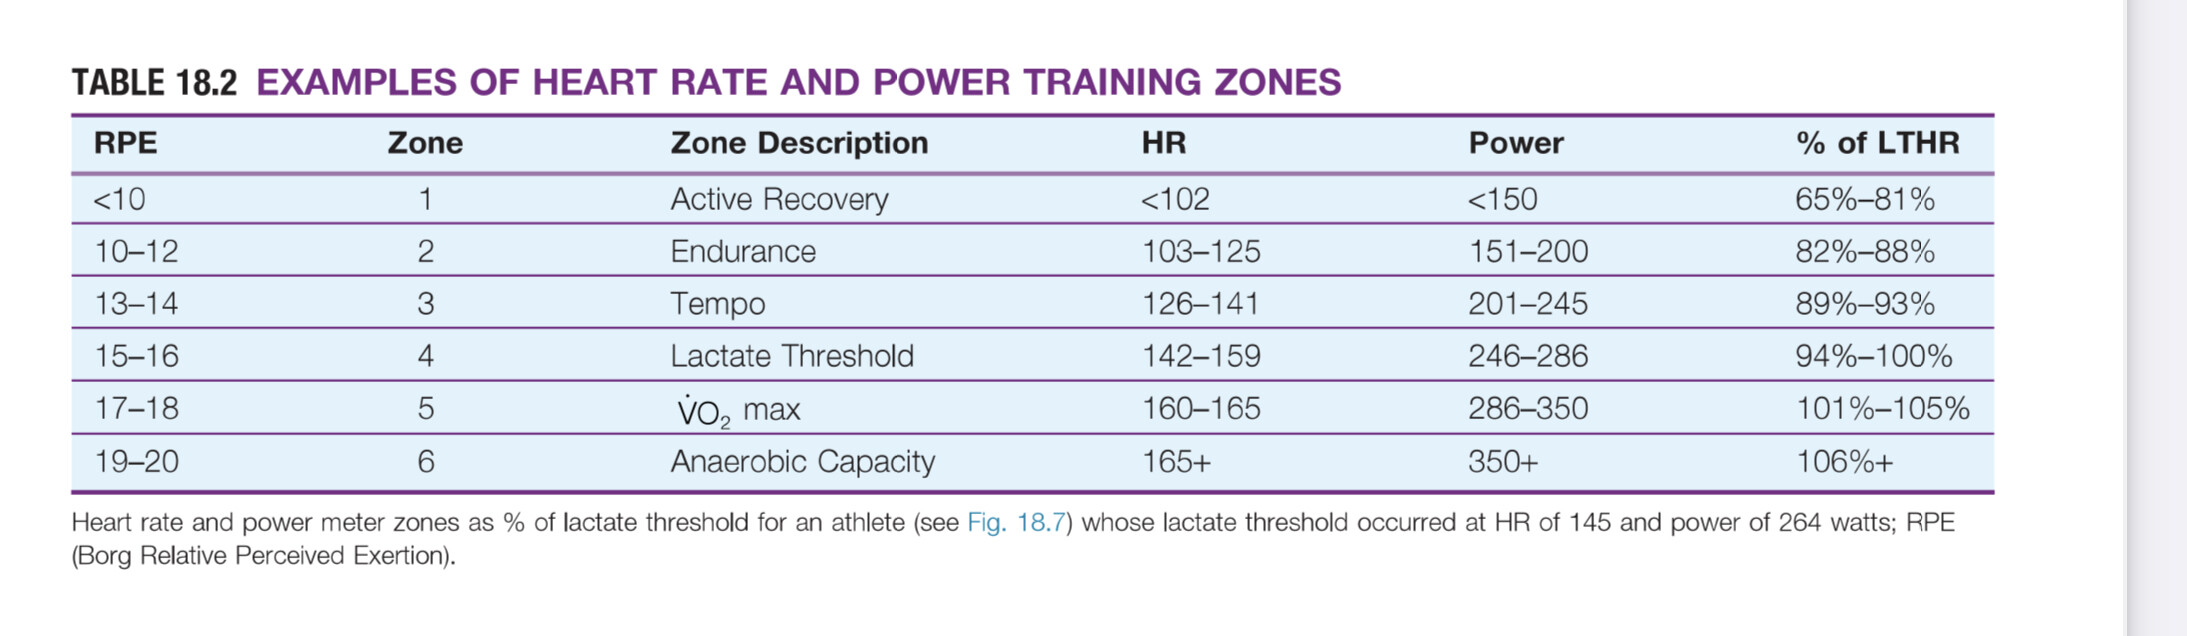
I’m a little confused. Near the beginning of this thread, you stated that in the 3 Zone model (as used by Seiler),
Z1 = Z1+Z2 (5 Zone)
Z2 = Z3 (5 Zone)
Z3 = Z4+Z5 (5 Zone)
But in this table you shared, LTHR (LT2) is at the upper bound of Z4. Which indicates that in this particular model Z2 = Z3+Z4
I’m just having a hard time trying to figure out whether I should set my HR zones as per Seiler’s 3 Zone model (with LTHR as upper bound of my Zone 3 (5 Zone model), or if I should follow how Intervals.icu currently suggests with LTHR as upper bound of Z4 (5 Zone model).
I still don’t understand why Intervals.icu uses Z2 = Z3+Z4, where most articles I have read suggest that it should be just Z3
Thanks for any light you can shed on this and help a poor confused athlete out.
Ok, thank you for the clarification. Then I still don’t understand why Intervals.icu uses Z2 = Z3+Z4, where most articles I have read suggest that it should be just Z3