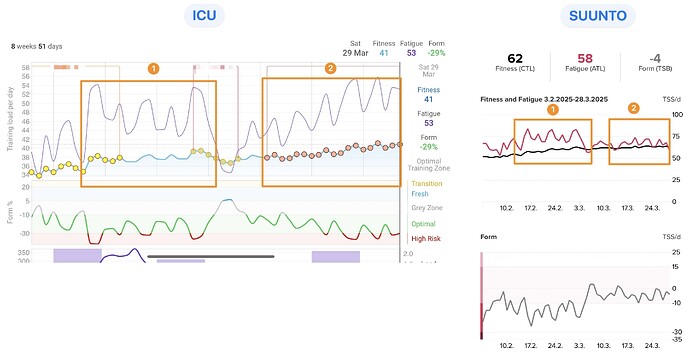
Hi all, I tried to figure this out and find an answer in the forum. I came to the conclusion that one shouldn’t focus too much on the Fitness, Form, Fatigue graphs.
But it still bothers me that when I compare the curves in the Suunto app with those of Intervals.icu, I notice deviations. If I compare the range 1 with each other, the curves look relatively identical, even if the absolute values are different.
When comparing range 2, however, it is then completely different curve in Intervals.icu. For Intervals.icu i’m in the high risk area, on the other hand for Suunto I am barely maintaining the fitness.
Also, how are the TSS numbers different in Intervals.icu and Suunto?
The data for Intervals.ICU comes directly from Suunto.
Thanks for any input on that.

