Hello,
is there a way to get an average of the efficiency factor or even the max for a season to see improvements? I can plot it per day but I I feel that might not show the progress that much since on recovery rides or slow rides the ratio is low. Not sure if it even makes sense to track this, I am still rather new to cycling I am just looking for ways how I can track if “I get better” and efficiency seems like a good metric to look at.
Thats a good one. The decoupling chart at the bottom of the activity power page uses %eFTP and %HRR. I used % eFTP instead of 6m power to make it more general to work for people who haven’t done a 6m max effort. So I would go with %eFTP / %HRR.
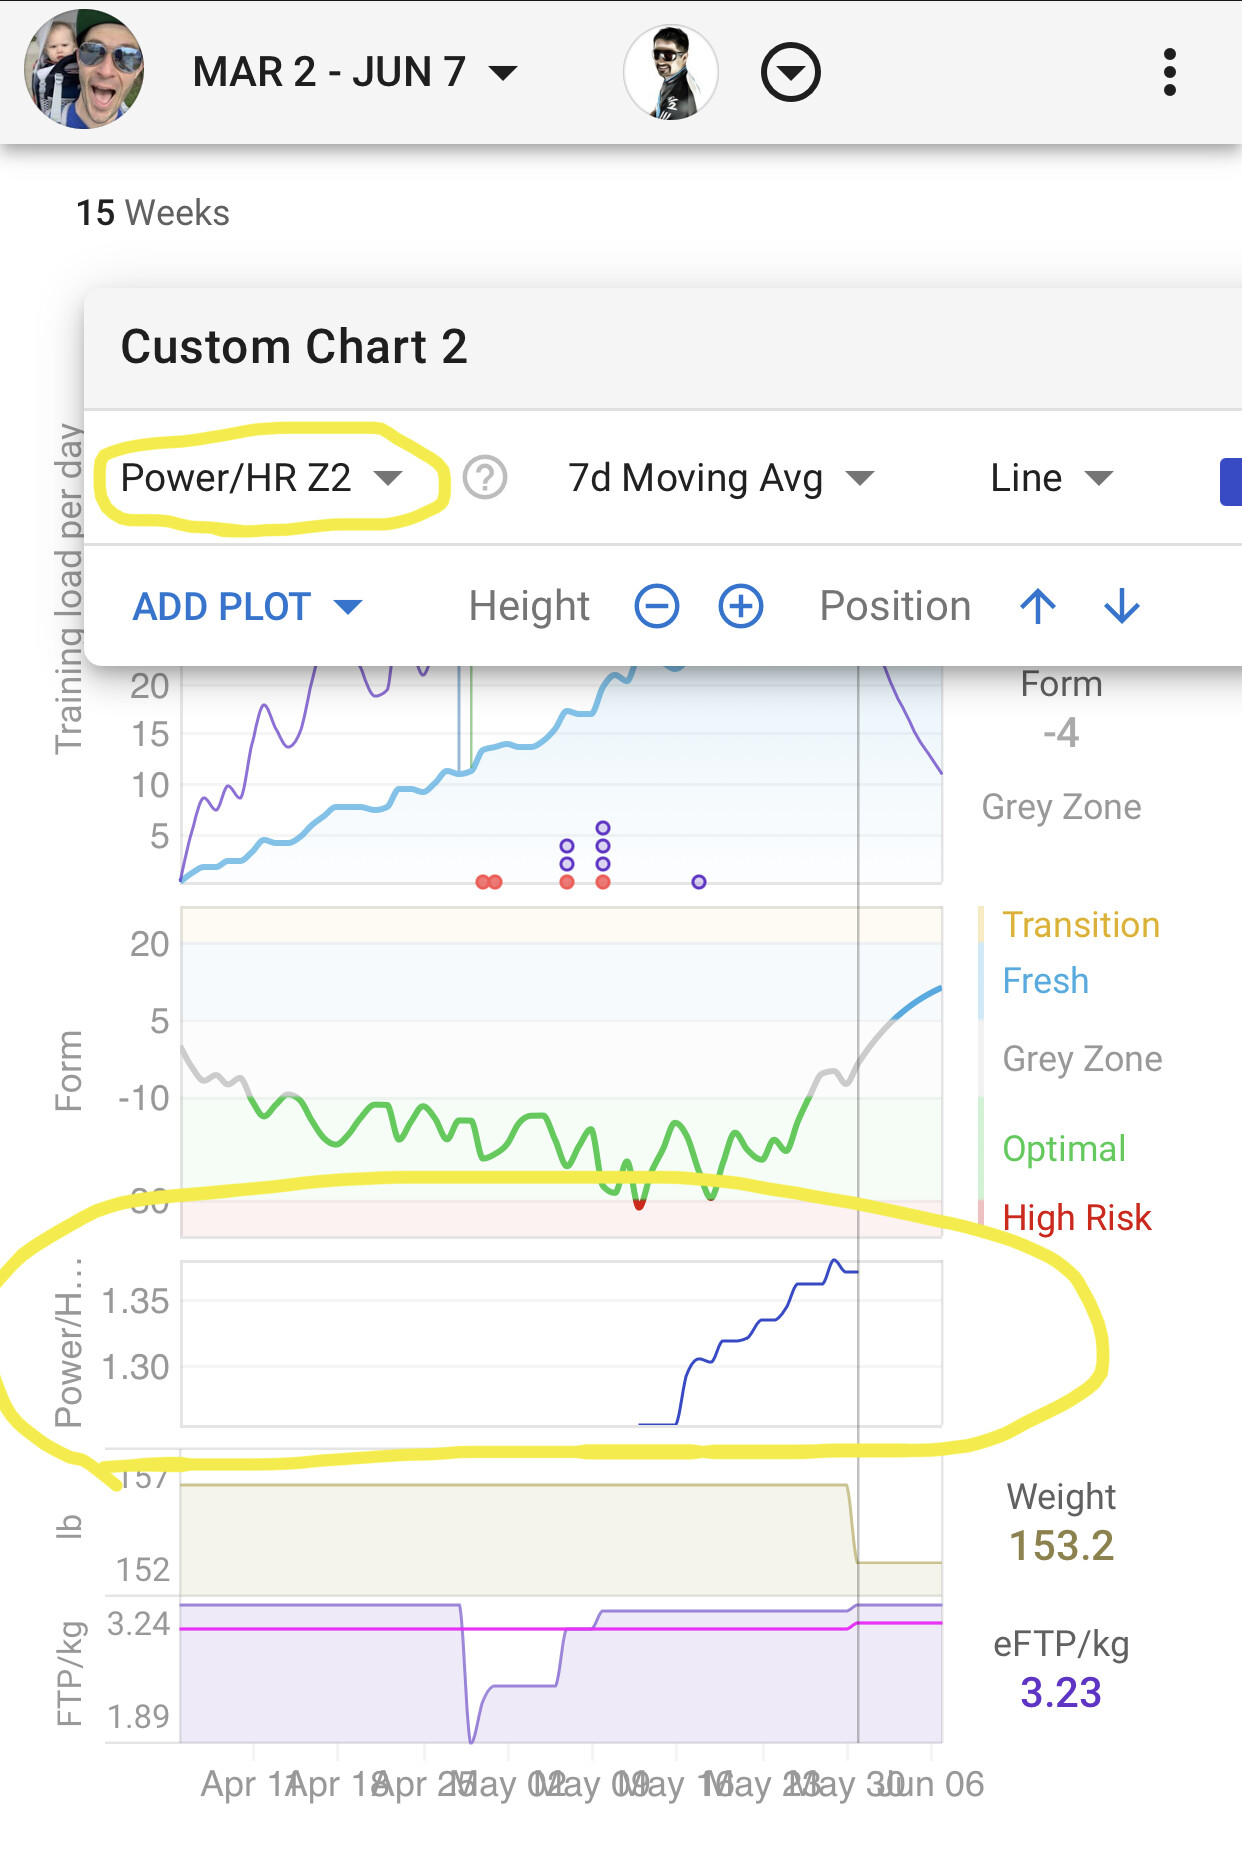
The power/HR Z2 metric already implemented has the advantage that is calculated from cleaned up and HR lag adjusted data points.
According to what I was getting was not totally linear but much better than the simple NP/HR or even NP/HRR.
The idea that I get from Dr. Seiler is that the Power metric he is looking for here will be a percentage of MAP (or VO2Max Power). The problem of using FTP related variables is that %HRR should have a fairly linear relationship with %MAP but, since FTP will be a percentage of MAP that can go from around 60 to 85% of FTP, the linearity will be lost around its proximity. Actually this could start happening above LT1.
Anyway, for around LT1 and bellow, I would say %eFTP/lagged%HRR will be much better than NP/HR.
So that suggestion of using Z2 makes a lot of sense to me.
Probably using something as the running ‘treshold pace’ that we set for athletes in their settings could do the job. Guessing if this could not be added in the ‘activity pace’ page as the decoupling chart is displayed for cycling activities.
Haven´t read the content of your link yet, but for me the running efficiency metric comes to mind. It´s meter per heartbeat. I use that to track my endurance performance.
Jim Vance uses that in his book ´Running with power´