You can now change the factors used to compute fatigue (ATL) and fitness (CTL). On the fitness page choose “Options” and then “Adjust Fitness Days”. Use the sliders to adjust and the chart will redraw.
Found the 7 days and 42 days description before
And trust the guys who set them years ago
Never stopped to find out how or if these should be adjusted for gender and age and actual form,
So took them for what they are, numbers for guidance.
Then you allow me to change them, the pictures are different, and actually, Adding to fatigue and subtracting from fitness, makes it look less like a rollercoaster, and align more to how I feel changes in exercises influences.
I think it is great you can set this but myself I don’t dare to change the values. Probably I should to correct for age because recovery is slower when onder and fitness is declining faster. Problems that I don’t know enough about this subject to make changes.
Same with me I built this to see the impact but ended up staying with the defaults. I haven’t been able to find a nice writeup on when/if its a good idea to change.
You may have seen this, but I quote: “The default time constants of the Performance Manager, i.e., 42 d (6 wk) for CTL and 7 d (1 wk) for ATL were chosen as nominal values based on the scientific literature. As with the fitness component of the impulse-response model, the precise time constant used to calculate CTL in the Performance Manager has a limited impact, and although users may still wish to experiment with changing this value, there seems little to be gained from this approach. On the other hand, the calculations in the Performance Manager are sensitive to the time constant used to calculate ATL, and hence TSB (since TSB = CTL – ATL). Thus, part of the art of using the Performance Manager consists of learning what time constant for ATL provides the greatest correspondence between how an athlete actually feels and/or performs on a particular day vs. how they might be expected to feel or perform based on their CTL/ATL/TSB. Again, experience indicates that younger individuals, those with a relatively low training load, and/or those preparing for events that place a greater premium on sustained power output (e.g., longer time trials, 24 MTB races, long distance triathlons) may obtain better results using a somewhat shorter time constant than the default value, e.g., 4-5 d instead of 7 d. Conversely, masters-aged athletes, those with a relatively high training load, and/or those preparing for events that place a greater premium on non-sustainable power output (e.g., shorter time trials, criteriums) may obtain better results using a somewhat longer time constant than the default value, e.g., 10-12 d instead of 7 d. (Of course, since athletes preparing for longer events often – but not always – “carry” higher overall training loads, this tends to constrain the optimal time constant more than would otherwise be the case.)”
Awesome feature, lets see if it helps with reviewing training history. In theory if a rider had outliers which they wanted to exclude, this new feature could be very useful.
Hi, I’d like to change my ATL from 7 to 9 based on some information on age and ATL in Training and Racing with a Power Meter. However, when I go to the fitness page and click options I see a different view. I’m just checking if this function still available
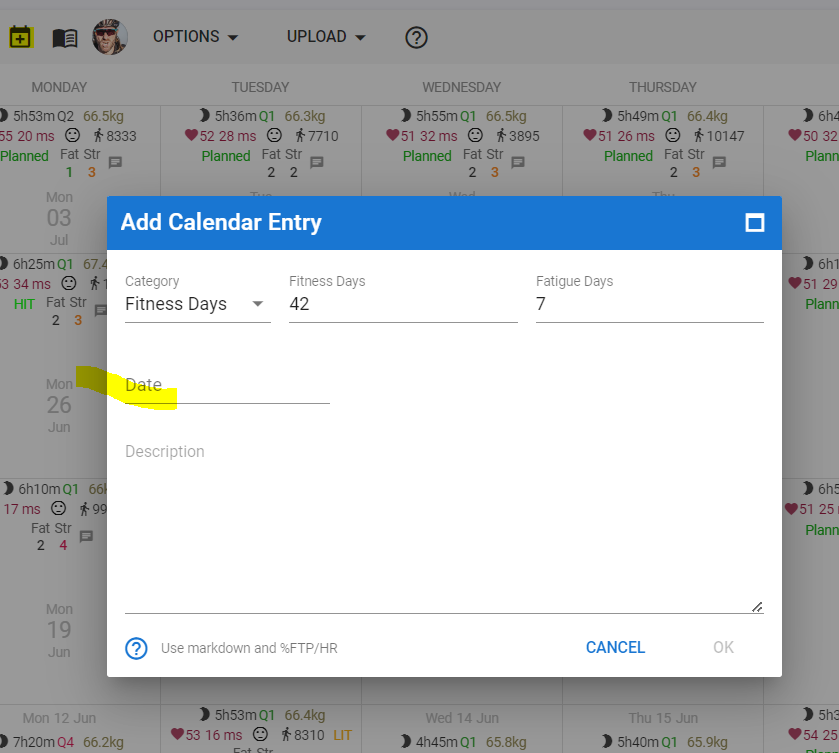
It is back just in a different form. You can now click a day on the calendar and add “Fitness Days” to change the days used from that date. You can make this in the past to update all of your history.
Hi There, I’ve used thiss feature to change ATL and CTL factors in the past, I’d like a Fitness 45d and Fatigue 10d from Jan 1st (more adequate for a 50+ cyclist).
I can do the change, but then, nothing changes in the Performance Mgr, am I missing something?
strange… didn’t change at all for me
to be clear, I introduced the new values on Jan 1st, expecting to see a change from that point in time through today
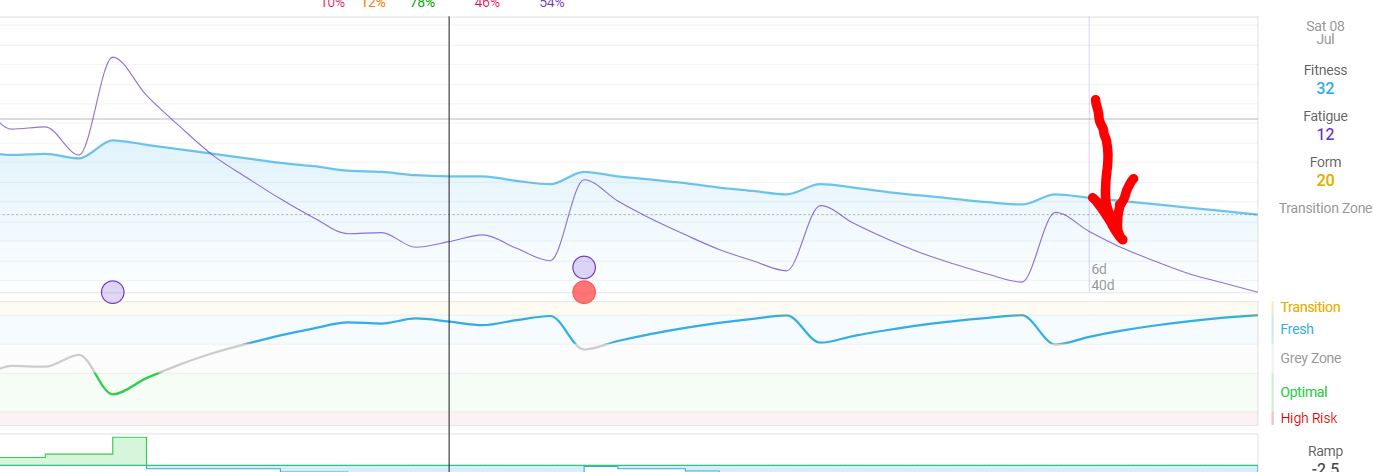
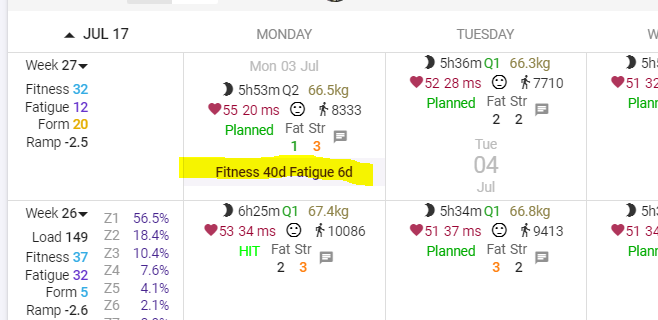
Changing these factors needs to be done on the date from where you want to change them. If you change them today, all future activities will use the new factors. A change will be indicated on the Fitness chart.
in the calendar click on Add Entry, Fitness days and the set the factors AND date from which you want to change them. I’m not sure if you need to reprocess or recalculate.
Thanks for showing me where to look and yes I do see this so I guess it has applied the change. I’ve changed the parameters to fit those I use in XERT.
A slightly separate question. My CTL in training Peaks is 83, XERT 79 but in intervals it is 60. I am definitely at the fitter end of my fitness when I have podiumed in my age class in mtb events so think that the Intervals figure is too low. How can I amend it to track that in XERT/TrainingPeaks and is it recommended?
Loving Intervals.icu by the way so want to ditch TrainingPeaks
Having podiumed in your age class, you are almost certainly aware of the fact that CTL isn’t a performance indicator. It’s a planning and analysis aid for load. Just to make sure that you’re not looking at it in the wrong way…
But the difference TP - Intervals is big and you should be able to find a reason for that. A couple points difference can be explained by rounding errors and slight differences in formula’s, but not a 25% difference.
Since ATL/CTL is the result of a Load calculation, the cause is probably differing loads for your activities.
You are talking MTB, do you have Power on your MTB or are you tracking Load by HR?
If load is derived from HR, that should explain the difference quite easily. Intervals has different ways of calculating load from HR which will yield different load numbers. There’s Time In Zones, Average HR and Normalized TRIMP. I don’t use TP, so I don’t know what they use and if they have different ways of calculating load from HR. Start by checking load for several activities in the last 6 weeks and compare between the two analysis suites. Change the settings and see if you can find something that is closer.
If load comes from Power, the difference should be very small on the condition that you have your FTP set equally in both softwares. That is, at every point in time. Intervals calculates Load from Power (almost) exactly the same way as TP does.
The difference in absolute numbers is one thing, but the trend in both should really be very similar. If that is not the case, there’s definitely something else going wrong.
Set the Activity List view in Intervals and add the Load column. Compare that with TP results and correct or come back here to see if we can help further.
Thanks for the reply MedTechCD. OK will do. And yes I have a XT 4iiii left crank power meter on the mtb, which is my only bike apart from the trainer that obviously has power. I think I remember first seeing this when I started Intervals.icu and wondered if it had anything to do with the initial figures I seeded the programme with? But then you would have thought that over time the figures would have normalised towards each other.
I use the XERT Threshold Power figure as my FTP in both TrainingPeaks and Intervals so when I get a breakthrough or it changes downwards I adjust the figures