Hi,
I guess the VLaMax comes from a 15s sprint or something like this ?
Do they explain how they pull the numbers from your data ?
With the kind of graph you have you can setup the CIQ app I was talking about a few posts earlier.
Hi,
I guess the VLaMax comes from a 15s sprint or something like this ?
Do they explain how they pull the numbers from your data ?
With the kind of graph you have you can setup the CIQ app I was talking about a few posts earlier.
All I did was put my 40-50m power and 6 min power in together with my weight. As far as I am concerned its a bit of a black box.
No explanation at all. It pulls in my rides from Strava (maybe not in the future though, depending on what happens) and does an analysis and spits out CHO & FAT utilisation range
Thats exactly what I did.
How accurate it is I don’t know but I’ve not bonked yet using it. I aim to consume about 50 -75% of the carbs used on ride
No black box there. They’ve implemented Mader’s model and are estimating macro usage from the model. The 40-50m power is a proxy for MLSS (or CP,FTP) and the 6m power is a proxy for VO2max (using something like 3.5 + 11.6*watts/body weight). Then they solve the model for VLaMax.
Once the model is solved, they can use some relationships to estimate fat and carb utilization. The daily breakdown is likely based on the average (or normalized) power of the workout.
Here’s someone else’s work that I like to share…they’ve done a really good job at explaining how to model works.
Note that the Python implementation is different than the website. Probably due to different constants. My implementation matches the website better.
Thats great, thanks. A little light reading for me. ![]()
I love these forums as I
I learn so much from them
This is way over my head. I’m used to spreadsheets but the last time I did any form of real maths and programming was when I was at University 50 years ago and I think it was in Fortran and/or Basic and have never touched it since.
A friend of us who used to visit this forum has also found the right formulas from the German physiologists papers to interpolate VLaMax from FTP & VO2Max… so there are modelizations out there but I don’t know if there is any real world physiological validations. People from Inscyd have never shown such papers AFAIK. In 2020 guys from Inscyd were in every podcast saying that VO2Max, VLaMax and FTP are intertwined, but we lack the hard proofs I guess…
I believe that many people have managed to replicate Mader’s model… I still have my spreadsheet to play with it…
Some papers have been published in english in recent years on the topic
The biggest problem still seems to me to be that most of the literature is still difficult to access and in German. The model uses several variables for calculations and even in the papers published by the Cologne group the value of these variables varies greatly.
Having said that… despite the lack of academic validation, this was the model that helped me the most to understand how to train (and eat). I think it’s almost unfair to compete with someone who trains without this information.
Is the model easy to understand and is it easy to know what to do with the data? Definitely not… I don’t know many coaches who know how to use the model to modify their athletes’ training, but the few I know who have understood how to use this data to prepare their athletes for races are having excellent results.
This is an interesting read:
In 2020 I tried using INSCYD to improve training, purchased 6 tests. After 6 months I wasn’t able to find any value. During 2019 I spent a lot of time investigating Mader’s work and studies, which is why I decided to try it in 2020.
Personally I’ve found the most value from using WKO5 to assist with decision making on training.
As a coach, I can say that the mader’s model works very well, with some considerations: the 2 components of the model are vo2max and Vlamax , so it’s very important that these two values are measured or correctly calculated. Especially the Vlamax (very challenging to calculate).
When these two metric are correctly measured, the model works fine. Everyone who has a lactate meter can self check its accuracy without tons of scientific papers; when “real world” matches “model” there’s nothing to say.
Second step: after the model you have to train and take decisions. This is the big part of the problem:
The model was built with elite athletes in mind (rowers and swimmers primary) that have “unlimited” time to train. The amateur athletes who has 6-10 hours/week can’t use the model at its full power because some adaptations needs very long time. For example, with 6-8 hours/week it’s possibile to increase Vlamax but it’s very difficult to decrease it. So, if you spend your time to decrease it with 6-8 hours/week, probably you’ll not see any changes. But the model give you the nutrition part, and it’s useful for everyone, even using others approach.
I think that for an amateur athletes an “hybrid” approach is the way to go; using Mader to built vo2max intervals and nutrition and other methods like power-duration to look at interventions for the general picture.
I, unfortunately, cannot see any way in which you can introduce any meaningful measure of carb utilisation beyond ~90 minutes. Even then, you are having to make a large amount of assumptions, but the figure calculated might still be of some practical use to coaches/athletes.
There’s a few key reasons why I cannot see it working:
Yes, lots of variables.
I’m still unclear on how accurate post-ride estimation of carb oxidation would be a game changer. We already have good guidelines as the basis for experimenting on what works for each of us.
Here is a recent study Increased exogenous but unaltered endogenous carbohydrate oxidation with combined fructose-maltodextrin ingested at 120 g h−1 versus 90 g h−1 at different ratios | European Journal of Applied Physiology
on ingesting 90g/hr vs 120g/hr carbs (fructose and maltodextrose):
3 hours and look at carb and fat oxidation which stayed about the same:
well trained cyclists with vo2max of 63 +/- 7, average FTP around 340W, and riding 3 hours upper zone2 somewhere in the 70-80% range.
They took ~60g or ~80g of carbs at start, and then 18g or 23g every 15 minutes.
Again, fat and carb oxidation rates stayed about the same.
I’ve done some 6-7 hour rides at .8 IF or greater, without much performance loss near the end. Here is one:
and another one 3 weeks later:
Fueled at 60-90g/hour.
Why do some consider post-ride carb estimation to be a game changer?
Can you share your spreadsheet?
I suppose in theory if you know exactly the amount of carbohydrate oxidised and ingested in a ride/race, you know exactly how much you need to ingest to maintain parity. The reality is very different!
The reality is my point.
And further, day to day, what and when you eat OFF the bike is more important! So if you are riding 2 hours a day, the focus should be on the other 22 hours!
Yep same here still, as reported before. I have an 18 minute commute with “143 grams CHO used” which is more than 10 times the Xert estimate. Probably because of one sprint that resulted in a 208W NP vs 128W average, though even 18 minutes of 208W average surely wouldn’t cost that much CHO?
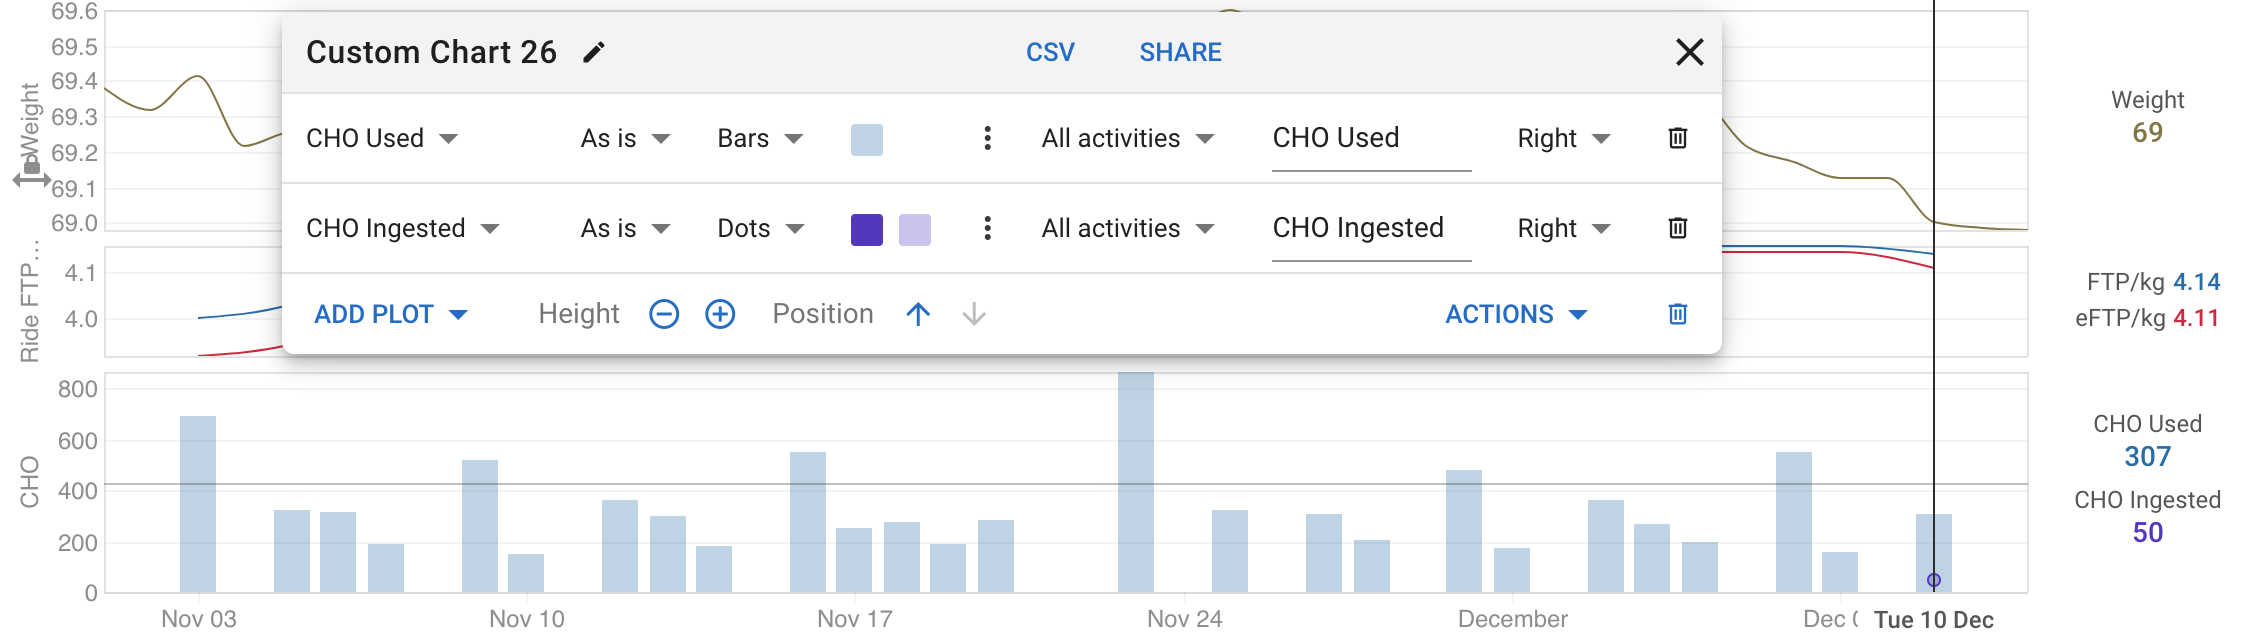
Has anyone been able to display CHO and CHO in in the activity in the calendar view? If so, could you please share the steps? I gave it a try, but I was unsuccessful. Similarly, I’d like to have a chart that plots CHO over time. I didn’t see a plot available for it.
CC @david
Thanks!
I have added those. I would be possible to do it yourself using custom activity fields but easy for me to do for everyone.
Thanks. Any plans to add auto-import from Garmin FIT file? Or does that exist now and I haven’t enabled it?
If you can figure out what field(s) are used for that I will try add it. I had a look at one of your recent rides on fitfileviewer.com but didn’t see anything obvious.
Thanks, recent rides I’ve been eating before & after.
Posted earlier