Why are there no “CHO used” at my running activities? It’s just shown on rides or virtual rides!? Do i have to make a setting anywhere? Thanks.
Currently this is only enabled for activities with power. I need to do some more work to support heart rate.
ok thanks… i’m still using power (stryd), with a set threshold…
Sorry I should have been more specific. It is also only cycling. I don’t think running power will work with this. When I do the HR version then running will be supported.
Hello guys, I have read a bunch of the topic but not the whole.
I have been interested for a while in energy consumption during an effort since it’s key to avoid bonking on a long effort. cf Xert Carb:fat model from Baron Biosystems is not for me ! – hic et nunc (a blog post of mine with examples)
For me, the numbers given by this TSS equation seem too high.
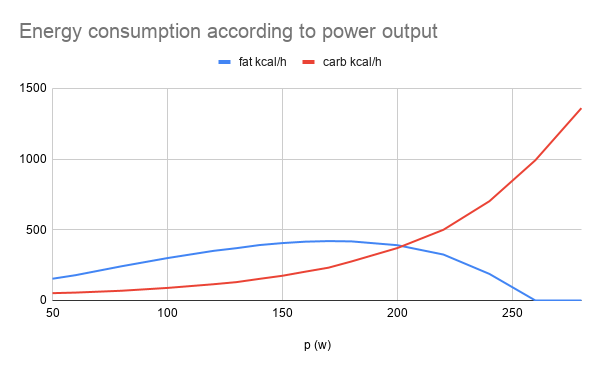
I have done several metabolic cart tests and converted the data to carb and fat consumption for a given range of power.
For example 150 W → 45 g/h ; 200 W → 100g of carbs/h
I use a CIQ app called Fat/Carbs Combustion Monitor that computes along your ride the fat and carb consumption according to your power.
This morning, I did an interval workout on the trainer.
My work is 906 kJ
My CIQ app gives me 54 g of fat → 486 kcal of fat and 101 g of carbs → 404 kcal, not perfect but IMHO it’s closer to my energy expenditure vs 194 g of carbs that the TSS equation gives.
What’s your thoughts on this ?
thanks
Intervals.icu is actually using the total work formula with variability index now, not the TSS one. I don’t know enough about this topic on that vs the CIQ app to comment.
It’s still overestimating for LIT / recovery / commute rides with high variability index. Riding 100w average and 127w NP gives me 300g / hour, while riding at 130w avg = NP it gives me 100g / hour, which still would be a bit high for me.
Here are a couple of useful things:
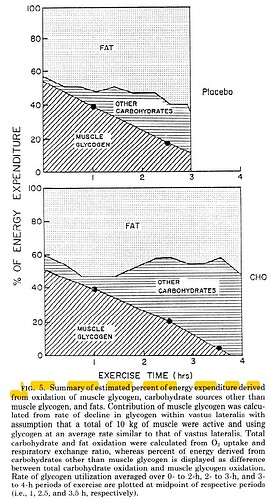
- From “Muscle glycogen utilization during prolonged strenuous exercise when fed carbohydrate” (Coyle, Coggan, Hemmert, Ivy; 1986)
Study measured time to exhaustion at ~72% VO2 Max (think tempo power), when fed a sweetened placebo vs. a CHO drink.
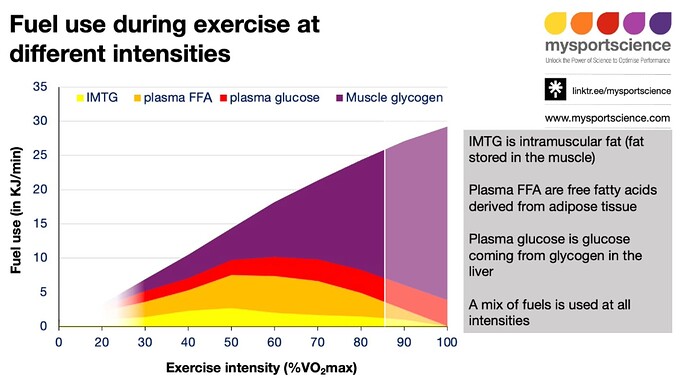
2. From "The effects of increasing exercise intensity on muscle fuel utilisation in humans" (Loon, Greenhaff, Constantin-Teodosiu, Saris, Wagenmakers; 200)
Fairly self-explanatory chart.
Same issue here with overestimation. 58min activity, 736kJ and carb estimation of 204g, which would basically mean, all the energy coming from carb. The workout was 10x20s sprints with only Z1/Z2 in between, intensity of 84%, variability 1.26 (Intervals.icu).
During long endurance ride, I also get almost all energy coming from carb, which does not look plausible.
Is Wmax Max Aerobic power ie basically between 5 or 6 minute Power?
This would be the game changer if it can be implemented. Similar to the way you can do it with INSCYD to add specific VO2 max or lactate data to support their algorithm.
I think something in that range but it doesn’t actually say. We have young, and pretty high-level cyclists in this study (mean of 5.48 L O2/min, which is a VOmax of 73.5 mL/kg/min), and their Wmax of 413 W.
This is consistent with the power->VO2 models suggest. I’ve never had my VO2 tested, but this summer at peak fitness I had a 6min peak power output of 415W (on a 6min strava hill segment) when I was right around 74.5 kg. VO2 max models suggest I’d have been ~70mL/kg/min for that effort.
They did 30min trials at 75% Wmax.
Thanks, so 75% would probably be around , maybe a little below, their FTP then.
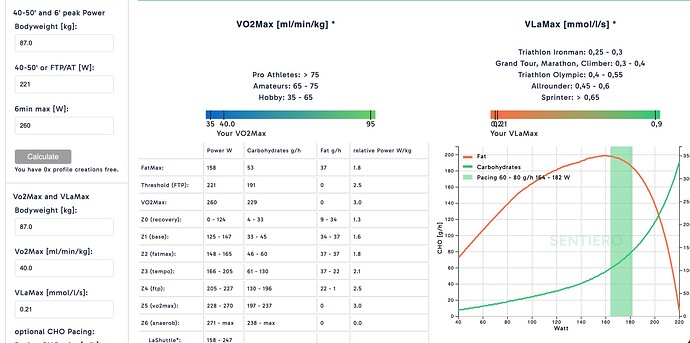
Have you seen this website. I ant comment on its accuracy but the total Fat & Carb usage are, for me very close to those I get from Xert, For what that’s worth.
Screen shot of my data
A bit below FTP was my guess as well. For myself, after 30min @ that power level, I’m thinking “I can keep doing this for quite a lot longer but it’s going to be going to feel bad.” ![]()
Nice layout of data they have! What’s it cost?
Free! You get 3 chances to update your values a month although that figure appears a little random.
I think it was a project of some physiology students or something that they just keep going on a shoestring.
As regards that study it would appear they had a FATMAX of about 0.8g/minute which is from what I read quite good.
This study may have been done in 1999/2000 as it was only published in 2001. Wasn’t that the era , amongst other things ![]() , of only eating 30g/hr or so of CHO. Their fat burning could therefore have been superior to an equivalent cohort today who are probably shovelling 90+g/hr of CHO on their rides and may not therefore be as FAT adapted. Just a thought.
, of only eating 30g/hr or so of CHO. Their fat burning could therefore have been superior to an equivalent cohort today who are probably shovelling 90+g/hr of CHO on their rides and may not therefore be as FAT adapted. Just a thought.
Interesting question about adaptations for super fat oxidation. I don’t know the answer.
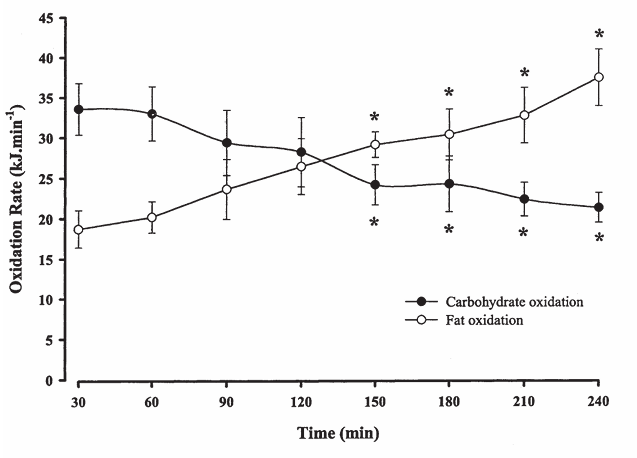
To compare the charts below, 1g of fat \approx 38 kJ of energy, and 1g carbs \approx 16 kJ of energy.
Here’s a snip from a 2001 study ( Intramuscular triacylglycerol, glycogen and acetyl group
metabolism during 4 h of moderate exercise in man) where strong cyclists (mean VO2 62mL/kg/min) tried to ride for 4 hours at 57% of VO2max (only 5 of 7 made it to 4 hours) without taking on any fuel.
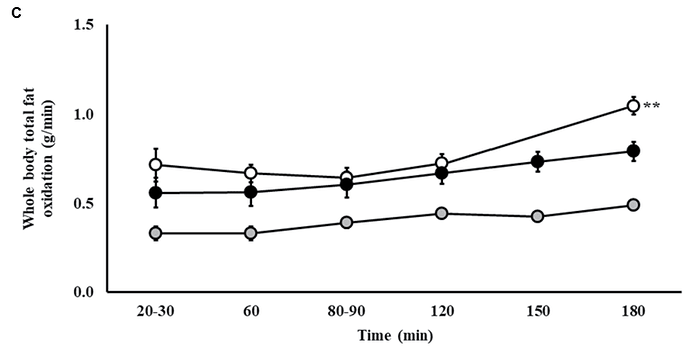
When we look at 90g carbs per hour, here’s another study (2022 - Feeding Tolerance, Glucose Availability, and Whole-Body Total Carbohydrate and Fat Oxidation in Male Endurance and Ultra-Endurance Runners in Response to Prolonged Exercise, Consuming a Habitual Mixed Macronutrient Diet and Carbohydrate Feeding During Exercise) that looked at CHO feeding tolerance in runners, with three feeding protocols:
Hollow: 30g gel-disc + 300g water every 20min @ 2:1 GLU:FRU (90g/hr); at minutes 0, 20, 40, 60, 80, 100, 120, but nothing in last hour.
Grey: 25g CHO drink every 20min (75g/hr, but unspecified sugar types) at same time intervals as hollow.
Black: 45g CHO drink @ 2:1 GLU:FRU (90g/hr), at 0, 30, 60, 90, 120, 150
Love this!!
I’ve been using https://saturdaymorning.fit/ for several years now, having a dedicated space to record carbs in is fantastic ![]()
one of the pics
a bit hand wavy, but good enough to convey the basics.
Is there really enough empirical data to stand behind some of the algorithms posted in studies above?
The body is a mixed fuel machine. Clearly when it runs low on carbs then fat oxidation is going to increase. Or if you don’t feed yourself carbs then fat oxidation is going to increase. And after 2 or 3 or 4 hours, whenever your muscle glycogen gets depleted, you are going to burn more exogenous (from eating and drinking) carbs and likely more fat too.
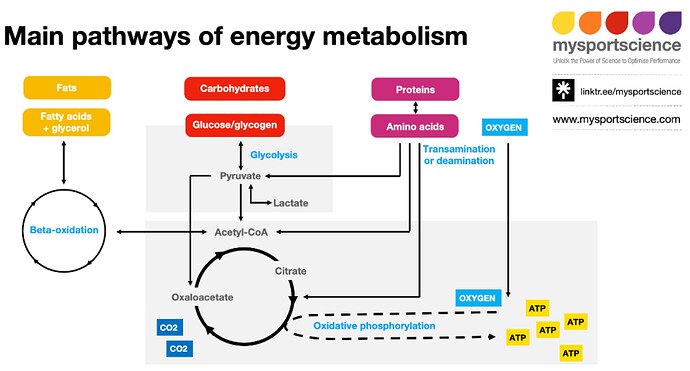
Back to MySportScience. On the far right of this chart is transanimation or deanimation:
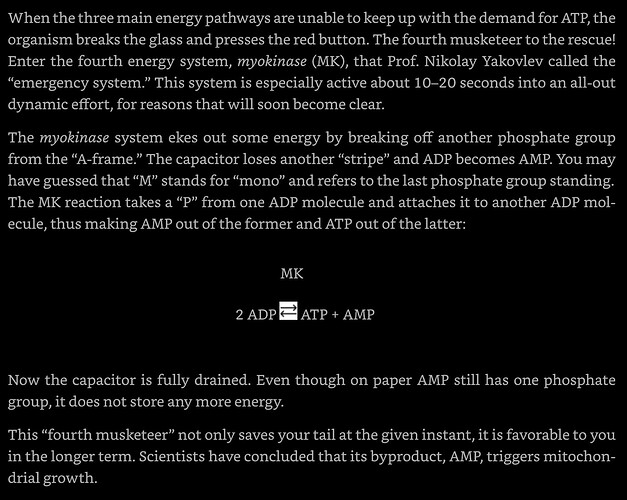
Best readable explanation of deanimation that I’ve ever read is in Pavel Tsatsouline’s The Quick and the Dead: Total Training for the Advanced Minimalist
I used one of his Quick&Dead (Q&D) minimalist protocols this summer, and experience “what the hell effects” (WTHEs) on the bike. Don’t know if it really triggered mitochondrial growth, all I can say is that 3 months of almost no cycling I went out and nailed the best 5-min power on the bike of 2024.
![]()
