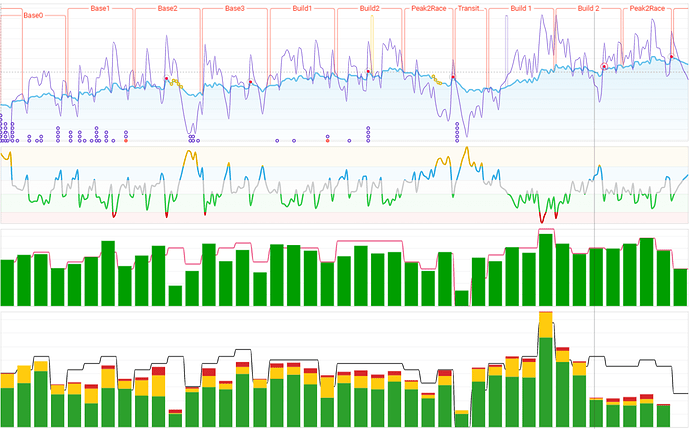
Annual Training Plan

Thanks @David for the ultrafast support! :slight_smile:
However, the target load still has “infinite precision” here:-o


image

Sorry forgot to mention that you need to delete that plot from your chart and re-add it to get the fix.

1 Like

The easiest way to do this is to just use “Notes” instead of “Holiday” and use “Holiday” as the name of the note.

2 Likes

:rofl:
Yes, I am using that workaround, too;-)

1 Like

Hi - apologies as I realise this is an old thread now, but agree with this suggestion and the replies - what we’re looking for is the kind of chart you get in TrainerRoad or Trainingpeaks that allows you to plot and visualise your plan over the course of a season, and better plan towards events. The weekly summaries are great, but having a plot ahead in a graph would be super helpful :slight_smile:

So you mean having the fitness chart visible in some way on the calendar page? You can see fitness for future dates on that chart.

hi - yeah I guess this kind of does a similar thing (thanks for this tip, I’ve now moved my chart out into the future by a month to see future fitness based on planned workouts)

This was what I was meaning though:

You can do this using the notes feature and putting in outline workouts ahead of time to etc.

Appreciate its not completely the same as TP functionality but it is a good middle ground.

I mark out weeks and training blocks and some outline workouts and then start to fill them out in more detail as I settle on what a block is going to look like.

I would suggest that having an outline of what you need and want to do ahead of a event is good but the detail of that is best planned on shorter time frame - eg. 6 weeks - as a lot can change block to block.

2 Likes

Thanks Olly, that make sense :+1:t2:

I use “Holidays” for single day Holidays and Notes for Vacations

I use a layered approach, where the initial planning is done in Excel (ATP). I then add notes to replicate my ATP from Excel, for the full year, to show the various training blocks (Mesocycles). The weekly target values (Microcycles) are then updated on the activities/calendar pages (target hours and TSS). The graph on the fitness page then shows actual against my weekly target (TSS and Hours separately). It’s a makeshift plan that is similar to TP, but customised for my own use and that of the athletes.


7 Likes
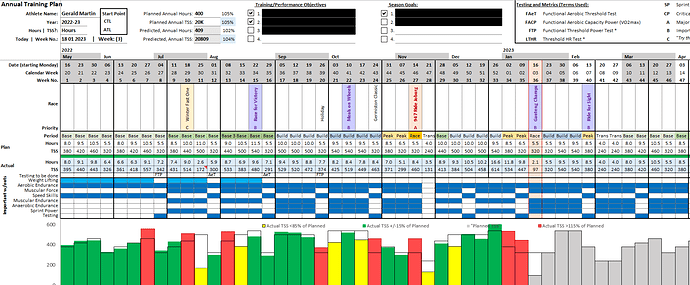
Impressive Excel, will use the picture as inspiration :slight_smile:

You can download the basic structure.

2 Likes

thanks Gerald for this nice description, only issue I have i cannot get the wellness data it says
“Access to resource is forbidden” where I am able to get the activity data. Hope you can help

1 Like

Have you setup permissions in Excel, i.e. the link to the API, using data source settings?

The access permissions are not complete.
Goto Data - Get Data - Data Source settings - Global Permissions - Edit Permissions - Edit Credentials.
Use Basic - The username = API_KEY and the password is your personal API-key found next to the UserId in Intervals.

1 Like

thanks made an error in the beginning that was saved to the blobal permissions it works now thanks!

1 Like

Hello! this post is now super long but I really have to sort through this ATP business in fairly short order. I did look thru and based on what I found it doesn’t work for me. So, my setup is I’m on a Mac with Office 365. When I pull the spreadsheet into Excel it’s a mess - so maybe I have the wrong one?

In any event, can you advise if I can use the spreadsheet on Mac/Excel 365 (client version)? And, can you put me toward the how to once I have the spreadsheet filled out?

I’ll check later, when I’m home; haven’t worked on the Mac version for a while. At the time, it didn’t allow using the Data Query.

Might be better to (unofficially) wait for the ATP in Intervals.

1 Like

The OData option is what should be used for Mac, but it doesn’t work for me.