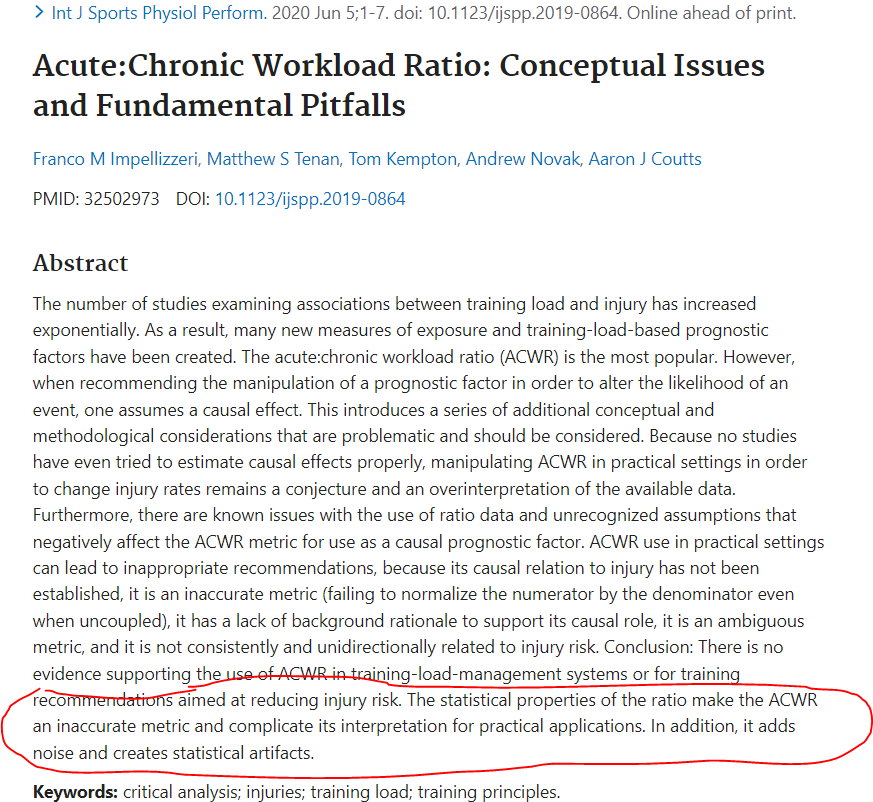
I have been searching to plot the ACWR (acute:chronic workload ratio) in a custom chart but couldnt find it.
Assuming I havent overlooked it, is it possible to add it as plot option?
The formula is quite simple: ACWR = ATL/CTL.
It can be interpreted as follows:
< 0.80 (under training and higher relative injury risk)
80 – 1.30 (optimal workload and lowest relative injury risk; the safe zone)
1.50 (overloading and highest relative injury risk)
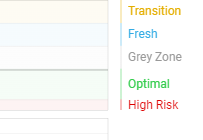
It would be nice to see these boundaries colored like with the Form% graph.
So undertraining could be grey, optimal could be green and overloading orange /red.
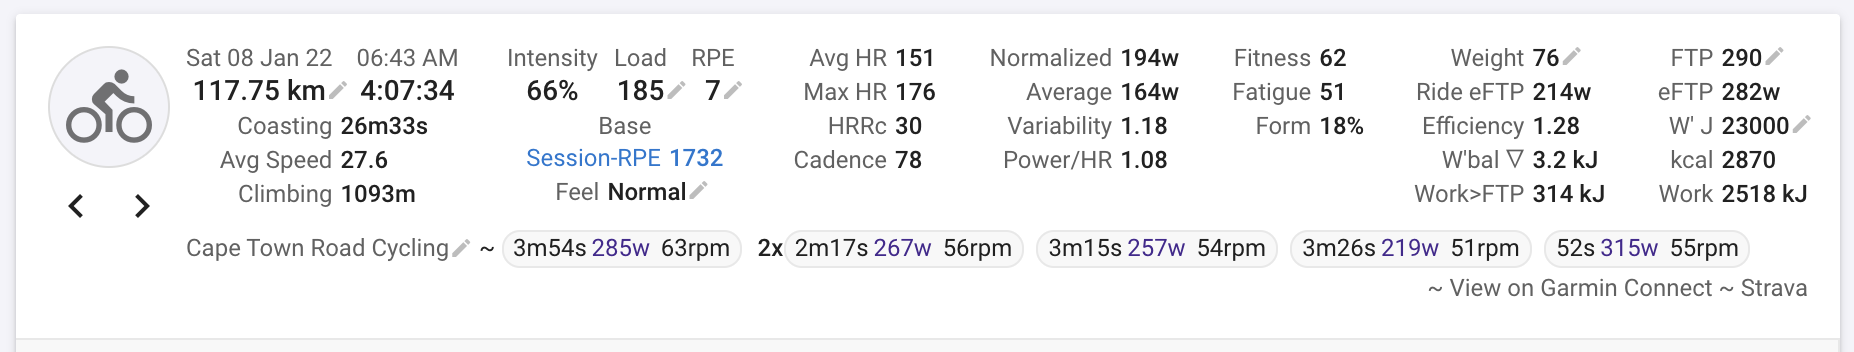
Would it be possible to include a metric RPE*Duration please? Known as session RPE.
This works well as a subjective measure of training load, and also quantifies without power and heart rate.
Athletes can then score their workout based on feel, and get a correlation between this and the objective data.
The ACWR would then be the same as ATL/CTL, as it would take the rolling average for 7d and 42d (or 28d as some studies have shown).
How would this best be named in the app? I know the concept is “Session-RPE” but it gives you a training load number so maybe “RPE Load” or stick with “Session-RPE” or “Session RPE”?
Ok I have added “Session-RPE” as an activity field (shows on summary page and in activity list) and plot for the /fitness page. Will deploy Sat AM (GMT+2).
ACWR is live now. It is available as a plot on the /fitness page. Session-RPE is also there but that will only work from Sat AM (GMT+2) when the server side of this is deployed.
'< 0.80 - [GREY] under training and higher relative injury risk
'0.80–1.30 - [GREEN] optimal workload and lowest relative injury risk; the safe zone
'> 1.5 -[RED] overloading and highest relative injury risk
Aim ofcourse is to stay within the Green band
Thanks again!
I had forgotten about that thread from nearly a year ago. Intervals.icu has session-RPE now but as you point out the RPE scale isn’t the same as Fosters. I will add Monotony Score (rMS) and Weekly Training Strain (rWTS) as soon as I can. Then it should be possible to plot all this in /fitness.
@Johan_Barelds I am going to make it possible to add colour scales to plots soon.
I’m finding that when my form is in the Optimal zone the ACWR is over 1.5. In other words, Optimal Form is high injury risk in ACWR. Not sure if this is always true, or a result of my particular training status. But at least some of the time, the predictions are conflicting.