Section 13
Planned and Actual Ride data
This section view will change depending on the setting you have chosen in OPTIONS (section 7).
The default view (for me) is Compact, and if I want more information I will click on the workout to see the more detailed view.
So let’s look at one day, and the information you can see:
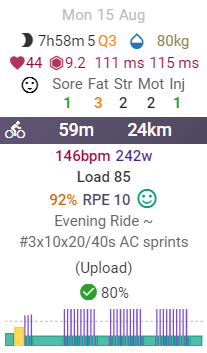
RIDE SUMMARY - with colour bar
The next section shows the ride plan, as well as ride data (if completed). It could also be blank, or it could show notes. Below represents a ride with a paired workout:
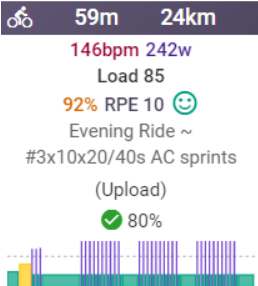
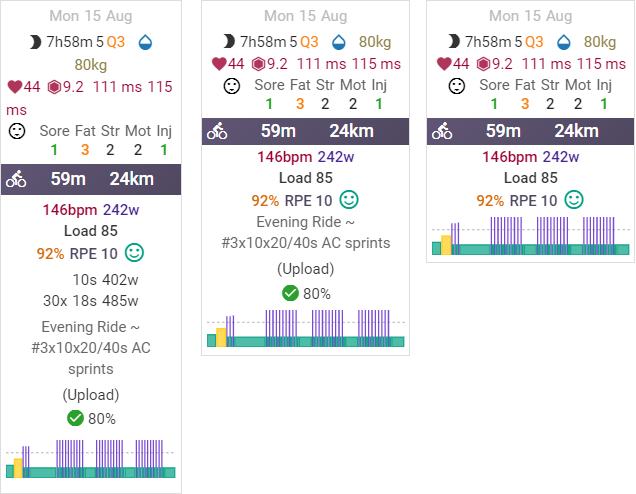
This will change depending on the view selected, eg. Normal, Compact and Minimal

The icon shows the activity type, eg. Run, Ride, Strength, Swim, etc.
Duration is next, in hours and minutes.
Distance is the on the right side of the colour bar.
The colours can be changed in OPTIONS (Section 7), as follows:
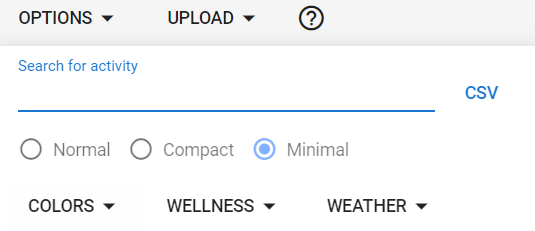
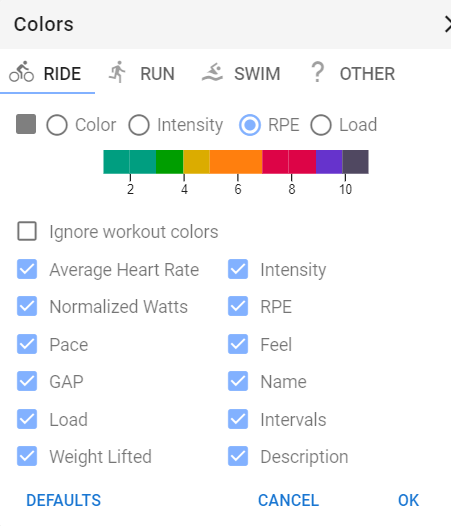
Options available or custom colour, based on intensity, RPE or Load.
There are custom settings options for Intensity and Load, whereas RPE is set at 1-10 only.
Further options allow you to tick (show) or untick (hide) the following options:
- Ignore workout colours will use the default colour for the activity (see section 2&3 above).
- Average Heart Rate & Intensity
- Normalised Watts and RPE (Rate of Perceived Exertion)
- Pace and Feel
- GAP (grade adjusted pace) and Name (of workout)
- Load and Intervals
- Weight lifted and Description (of workout)
DEFAULTS returns the settings to the normal, i.e. no colour based on Intensity, RPE nor Load.
CANCEL closes and doesn’t save
OK closes and saves your changes
3. RIDE DATA
Clicking on the ride data opens the workout summary view, which will be covered in Section 16, below.
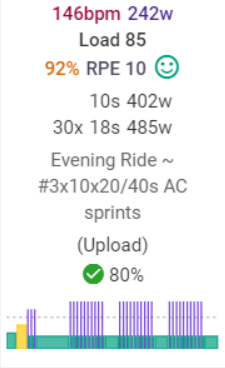
Depending on the view selected, you will see less/more information. In the Normal view, you will see:
- Average HR: 146bpm, and Normalised Power: 242W
- Load: 85
- Intensity: 92%, RPE score: 10 and Feel: Smiley/Grumpy face
- Intervals detected: 10s 402W and 30x 18s 485W
- Activity Name: Evening Ride ~
- Notes in the description: #3x10x20/40s AC sprints
- Source file: Garmin Connect, Strava, Polar, Upload, etc.
- Compliance to plan: 80%
* Green tick: less than 20% above/below the planned load
* Orange tick: 20-50% above/below the planned load
* Red tick: greater than 50% above/below the planned load - Workout graphic, if you had a detailed workout, using the Workout Builder.