I came across research that uncovers just how challenging it is to define Zone 2 (Z2) boundaries and why fixed zones might not work for everyone. There are always questions about zones and their classification, so this study is worth a look.
The study shows that physiological markers such as heart rate, lactate thresholds, and power output vary significantly between individuals—even among similarly trained athletes. This variability makes it almost impossible to create one-size-fits-all training prescriptions, as the metabolic demands of Z2 differ depending on how it’s defined.
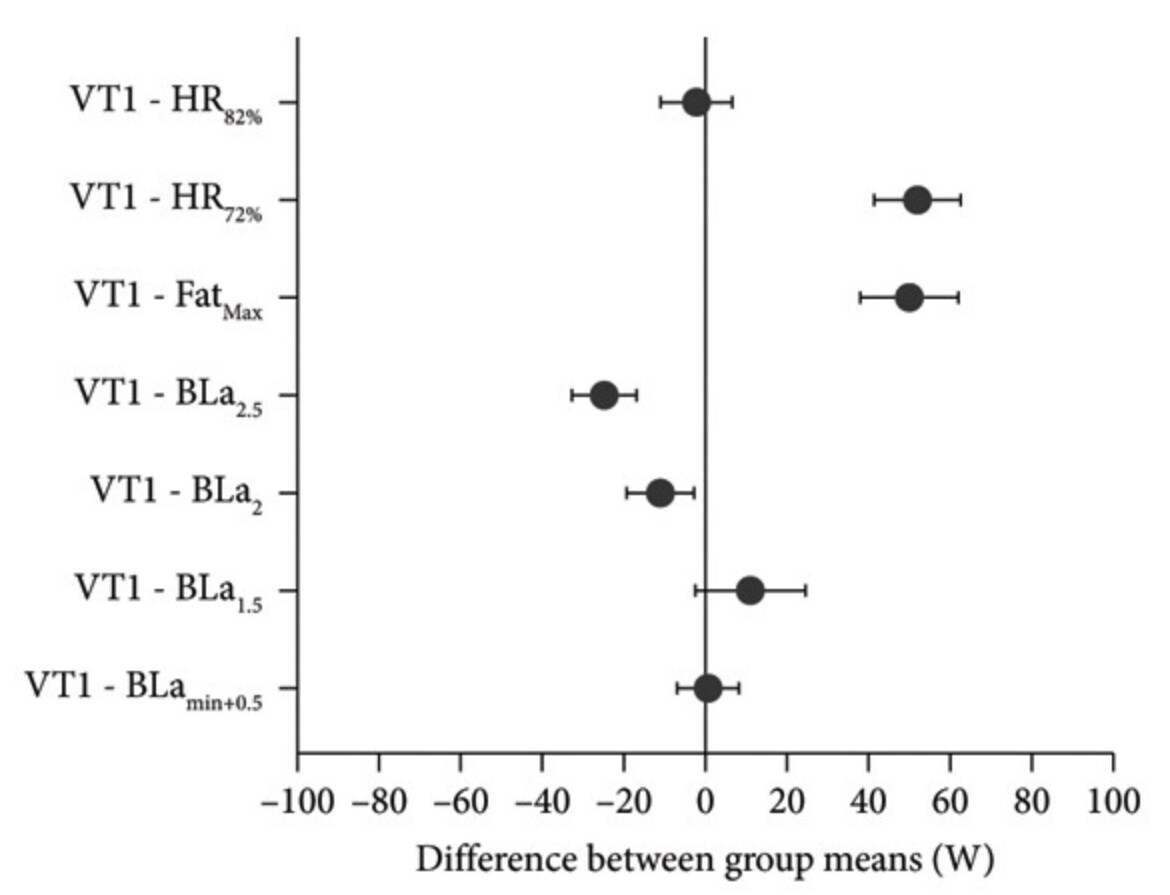
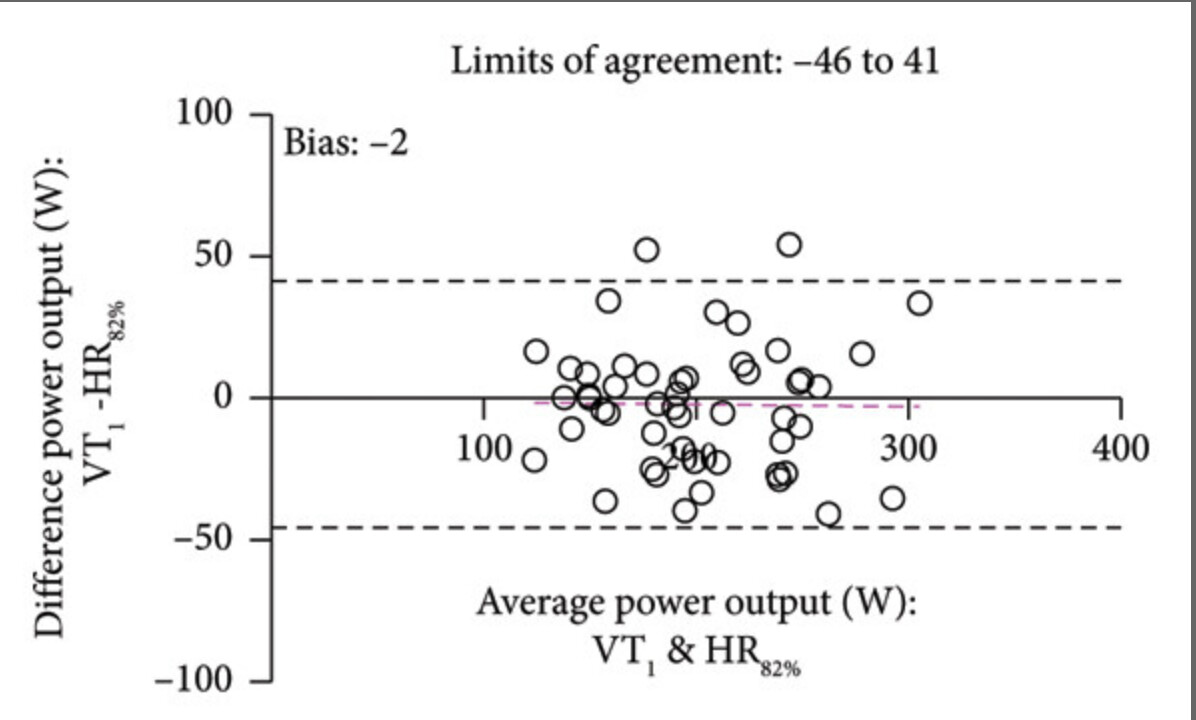
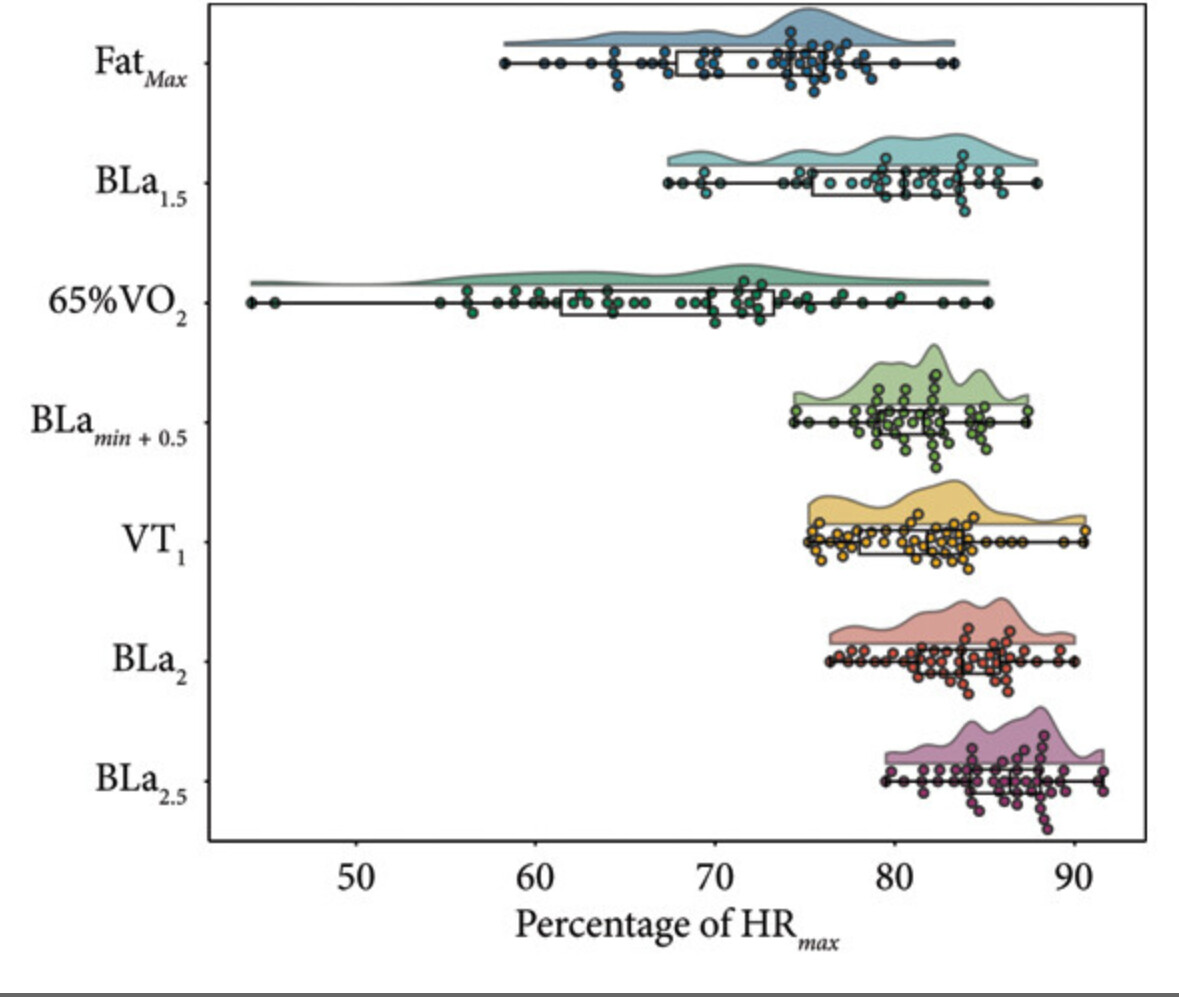
Interestingly, the research highlights that Z2 is not a single, universally applicable intensity domain but a concept shaped by individual factors. For example, while markers like VT1 and BLamin+0.5 align well, others like HR82% or HR72% show considerable variability. This means that athletes following fixed training zones might unintentionally over- or under-train, limiting their progress.
The study argues for a shift toward individualized markers like FatMax, VT1, or BLamin+0.5, which better capture each athlete’s unique metabolic profile. It also notes the importance of recognizing differences between male and female athletes, as physiological factors like muscle composition and hormonal influences can further complicate fixed training zones.
I do wonder why the last set of charts showed difference of means instead of the Mean Squared Error. We’re interested in how well the values correlate for individuals (which MSE assesses), not the difference in means (which allows outliers in either direction to offset each other). Am I missing something here? (I admit that I haven’t studied statistics in a very long time)
Another note is that VT_1 and BLa_min+0.5 seem to correlate very well. This is the Zone 2 that Peter Attia has popularized, and the data supports his recommendation that the talking test is a perfectly adequate substitute for lactate testing for most people.
This is very timely and interesting! I had a lab lactate and vo2 running test done earlier today as my recent training sessions were not matching with prescribed zones, RPE & paces etc. Things were just not adding up.
Turns out from lactate measurements that my z2 extends to almost 90% of my max HR! So ALL my zones and paces have been wildly wrong for a long time. What I thought was my LTHR is actually lower than the top of my z2 HR
Turns out 20 years endurance cycling does shift AT even when you transfer it across to running specific test but also shows how wildly inaccurate all the prescribed % zones can be in certain situations.
I concur with the study. Thus, at least once a week during prolonged endurance efforts, I carry a lactate reader to pinpoint target zone pace/wattage/HR. Anything else is either point-in-time or not precise.
This isn’t really surprising though, is it? The simple 5 zones aren’t widely implemented because it’s super correct, but because it’s easy and requires nothing more than a HR monitor and is in the ball park for a lot of people. For anything more correct you need lab testing.
The choice of metric could depend on the study’s focus. But I don’t know why the could have chosen it. I agree that it does offset the outliers.
I think the goal of the paper was to emphasize that universal guidelines (like %HRmax or fixed blood lactate levels) aren’t suitable for everyone because of the significant interindividual physiological differences. And even if you do lab testing, which method you are using to determine your zones? You are talking about HR. Do you determine your zones by HRmax, HRR, Threshold HR? There are so many zone distribution “guidelines”.
If we agree to accept VT1 as the first “threshold”, then you could argue that HR82% mean value is nearly identical.