Hello !
I like Intervals.icu more than Strava for workout analysis, the datas are clear, it’s easy to setup and very understandable. I find the fitness curve much more real than with other models and the TFP model does not increase my real FTP like Garmin ! 
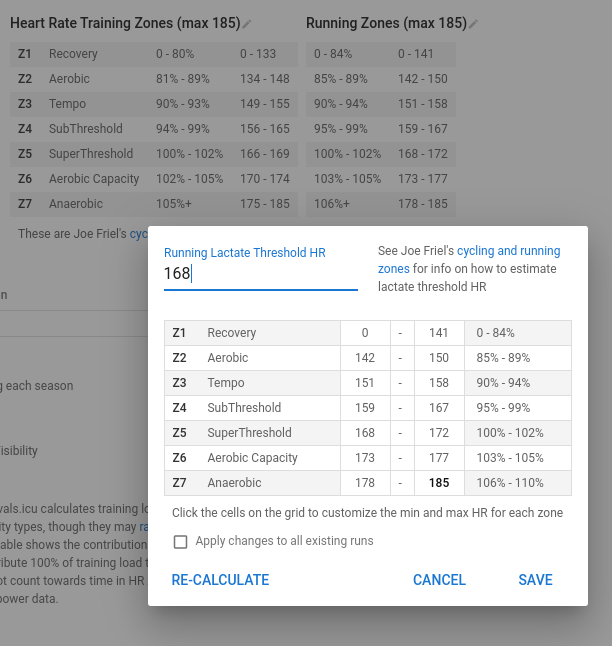
Regarding clycling, power model is perfect. For running, which is not in watts but in %LTHR, I’m curious about zone 2 : it’s 85/89% LTHR… I find it high. In my case it’s 135/143, but with all others model my Z2 is about 120/130.
I know every models are differents, but Z2 is very important as it defines 80% of my work : working at 125 is really not the same that 143 for a 90min run for example.
My question only concerns Z2, Z4/Z5 fit great.
You can setup the HR training zones anyway you want by clicking on the individual cells and editing them. If you click Recalculate, they are set back to the built-in %.
1 Like
Tks for your answer, I will do that. I was just wondering why this différence…
Same here. I wanna know the difference because we can be doing a season with the zones completely wrong
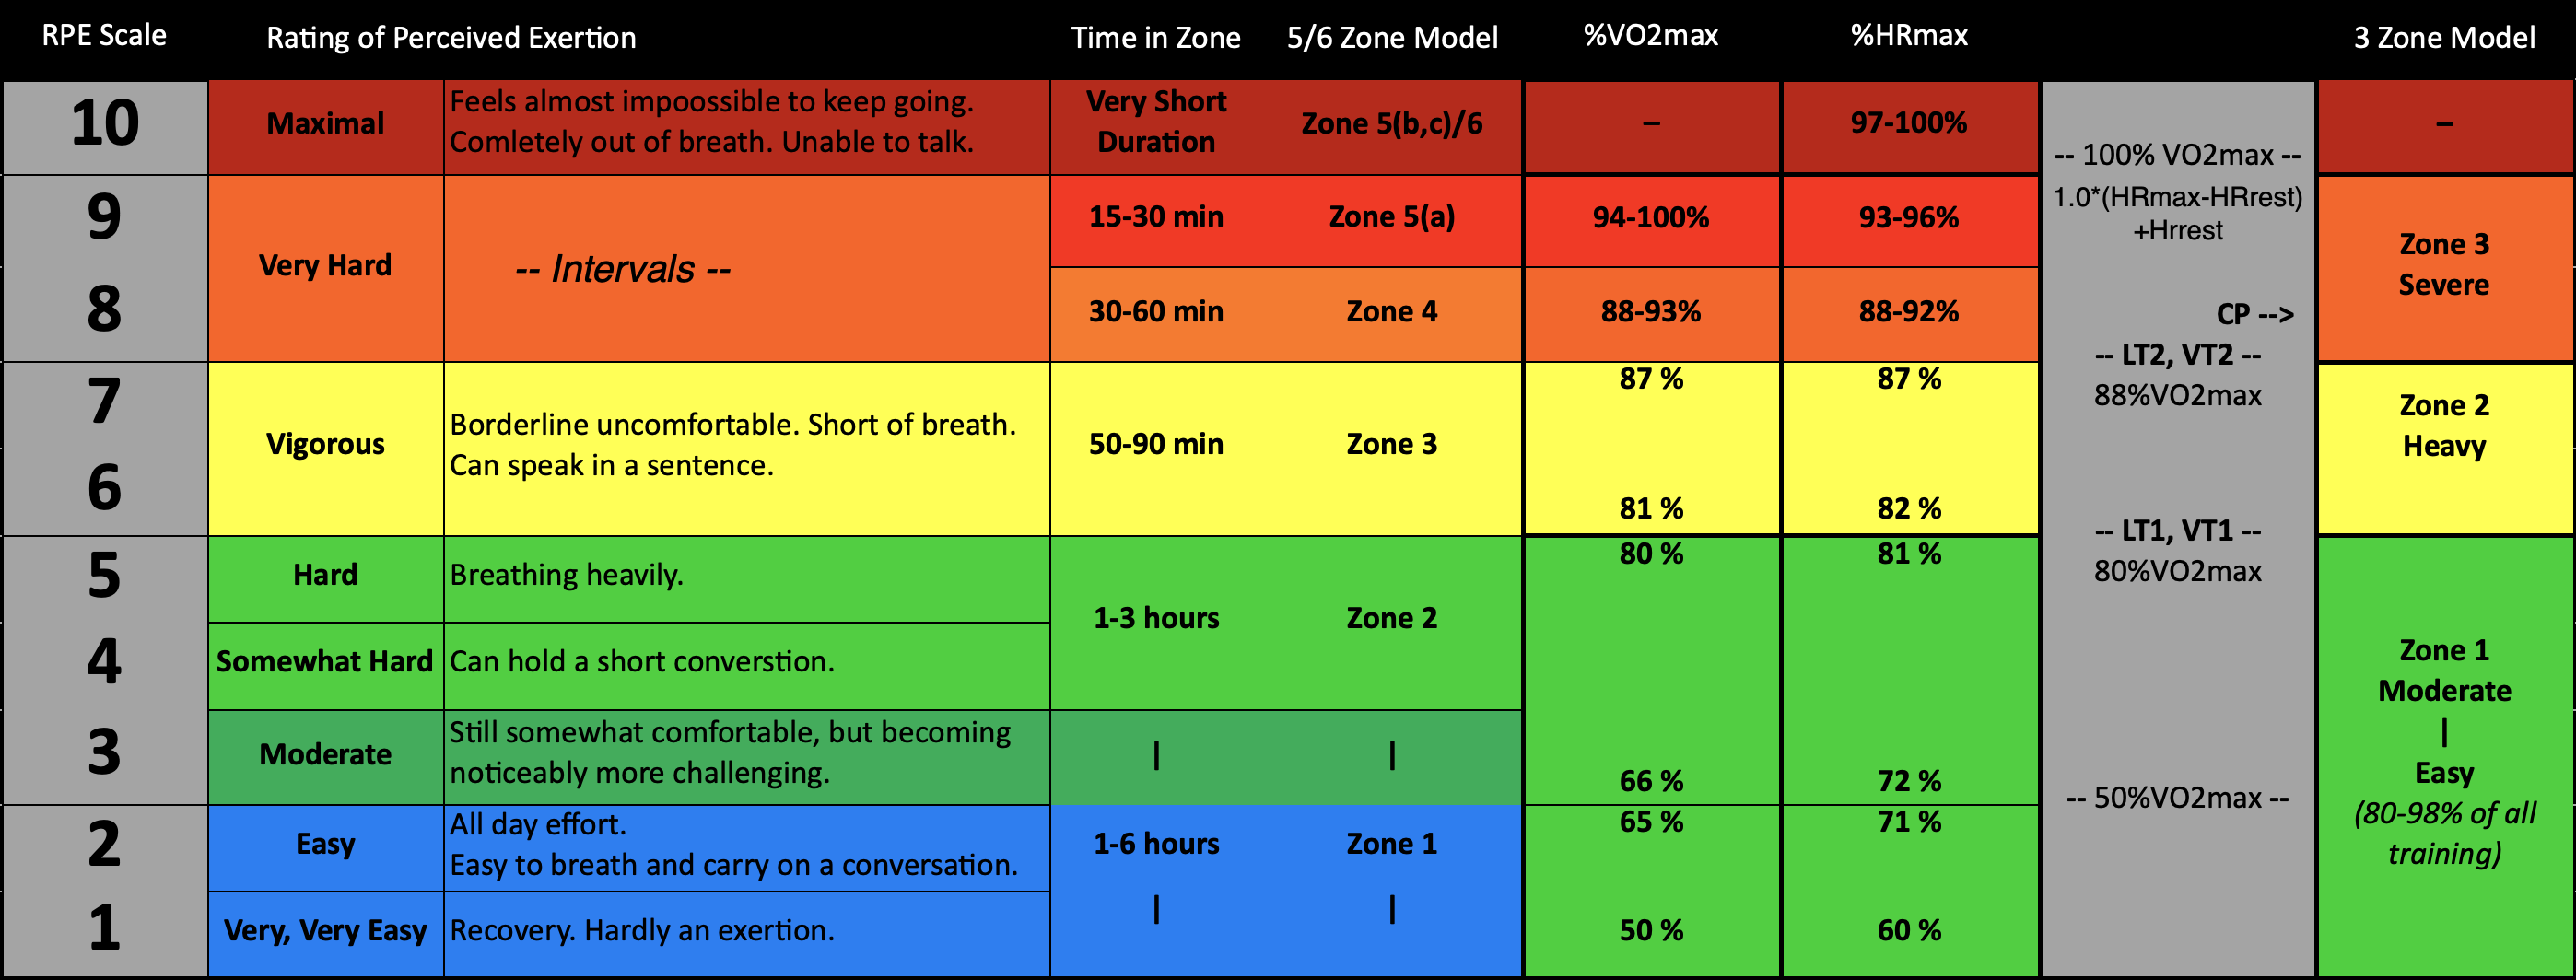
All the exercise physiologists and energists I interact with base HR zones (running and biking) on maxHR, Karvonen or %VO2MaxHR (if known). Attached is a chart that attempts to align the similarities of %'s as used by Alan Couzens, Stephen Seiler, Shawn Bearden, Rob Sleamaker/Ray Browning, Karvonen, Coggan/Friel, Chris Hauth and others.
At the bottom of this post I provide links to a couple spreadsheets that auto-calculate your HR zones based on your max HR (for the discipline) and resting HR. Personally, I find that zones based on Sleamaker/Browning align most closely with my own lactate & ventilatory thresholds, as well as my experience over years of Ultraman training.
I can’t recommend this podcast enough. It’s Peter’s second conversation with Iñigo San-Millán, Ph.D… The first conversation is well worth a listen as well, although it gets a bit deeper into the weeds. If you don’t know who Dr San-Millán is, look at the show notes and follow him on Twitter.
Note #1—Polarised: There’s a reason for the 3 zone model: it’s based on two physiological occurrences. Dr Seiler has said that there are really only two zones—below LT1 and above it. The conversation with Dr San-Millán gives even more credence to polarised application and why it’s important to understand that zones vary by person.
Note #2—Power zones: Once I know my HR zones for bike and run I then look to see what watts I typically execute in real life for those HR’s. (IRL zones may be different than results from maximal lab tests.)
Spreadsheets
Zones_HR Calculator (numbers)
Zones_HR Calculator (xlsx)
5 Likes
Dt Attia just posted this, which describes all the processes I wrote about above.
2 Likes