Hello all,
I see in the Compare sections, there are already the “Power vs Heart rate” and “Intensity vs Heart rate” graphs that help to see my progress between Season A and Season B.
We can add custom graphs as well.
What graphs do you use to see your progress between 2 time ranges?
1 Like
I always use the fitness tab and the resultant chart to track my progress. Ramp metric positive number indicate increasing load over time, resulting in increasing fitness. Negative ramp ( which you will see if you take a day or two off the bike) indicates decreasing load and decreasingi fitness. This way you can tailor your training plan to whatever your goals are. If ramp rate is maintained at too high a positive number you risk burning out, so be careful how you use it. Stick to a rate you can maintain for a week and then take a rest day.
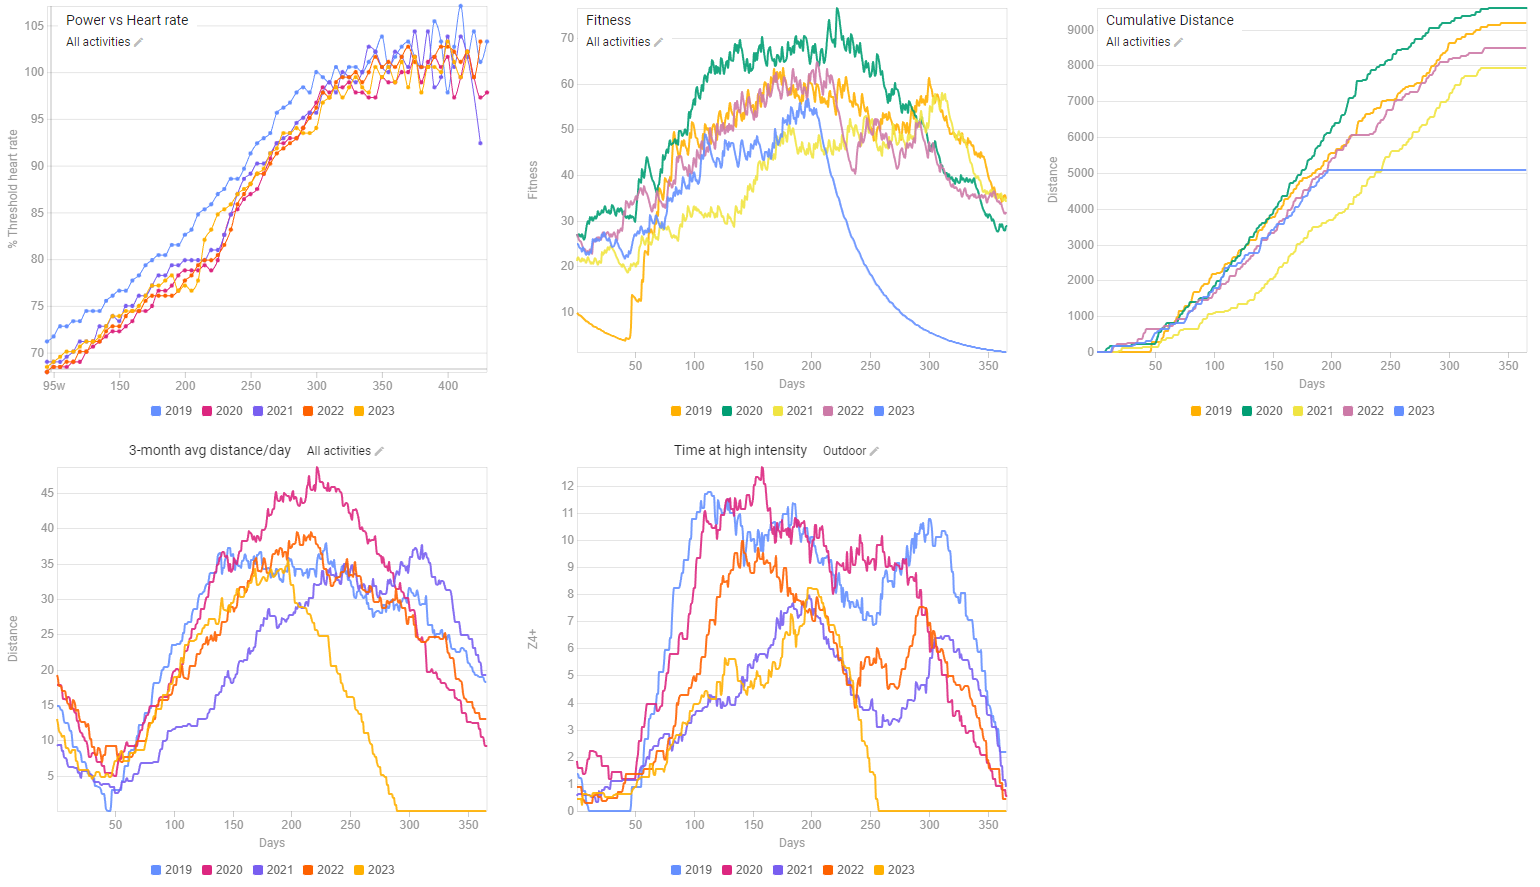
Here are my current graphs: