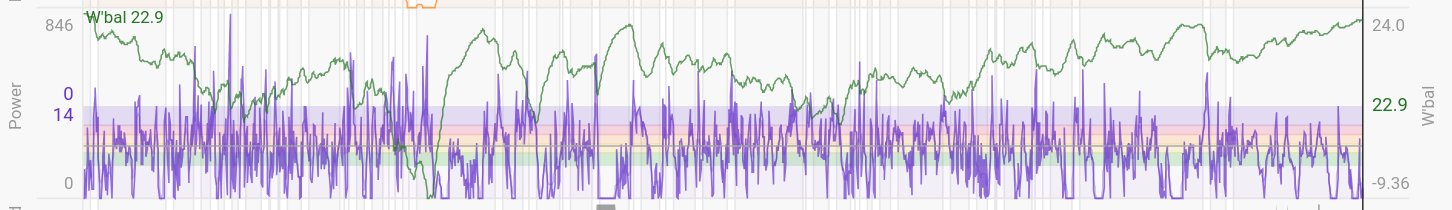
I really like the concept of W’ (and the 3 parameter model in general), but lately I’ve been seeing W’bal dip significantly below 0. For example, during yesterday’s group ride it went down to -9.36kJ. So, naturally I’d love to tweak the model parameters. I know that the proper way is to do some maximal efforts, but I’d rather ride outside in a way that’s fun (but possibly demanding - like the group ride yesterday or a somewhat hilly 16km TT) than do efforts solely to appease the math.
Naively, I could bump W’ up by 9.36kJ but that seems like wishful thinking given that my W’ is already at 24kJ (and eW’ is 23.871kJ).
This then suggests (IIUC) that my FTP/CP is too low. The activity eFTP was 279W, which matches my eFTP, and is just under the 280W FTP in settings. (The power page says my best eFTP since November was 288W.) I’d love to set it higher but I don’t have evidence to support setting high enough to (IMO) have a meaningful impact on W’bal.
Does anyone have any suggestions how to tweak the numbers to reduce or eliminate the negative W’bal?
I am tempted to leave the parameters alone and use the W’bal graph as sort of a relative measure of fatigue by ignoring the scale and just looking at when the dips occurred and how deep they were - knowing that the recovery and therefore the next dip’s starting point may be wrong (CP too low).
If you did a ride where your eFTP equals your set FTP (unless it was only 20min) your FTP is probably set low, and (obviously your W’ is set low!).
I’m assuming this ride did not feel like an all out effort where you could not go further or harder? (you shouldn’t be able to maintain FTP for more than an hour, and for most people TTE is usually 30-45min).
One approach would be to adjust the set FTP for the activity and reprocess until the W’ graph looks more realistic (eg at it’s lowest point it is 0 or above, and it’s closeness to zero matches how close you came to having to stop your effort).
I’d probably start with setting at 300W to see.
If you did a ride where your eFTP equals your set FTP (unless it was only 20min) your FTP is probably set low, …
Hm, I was under the impression that the algorithm behind eFTP would not get tripped up by rides longer than typical TTE.
and (obviously your W’ is set low!).
Isn’t 24kJ already quite good? I suppose changing FTP first (which will cause a faster W’bal recovery) will make W’bal less negative, and then it shouldn’t be an (absurd) increase of 10kJ.
Yesterday’s ride was a bit over 2 hours long. Since it was a group ride with some hills, the power was all over the place:
I’m assuming this ride did not feel like an all out effort where you could not go further or harder?
Given that it wasn’t a constant power effort, the answer is a mix of yes and no. At the end of the big hill climb (when W’bal hit the minimum of -9.36kJ; about 1/4 of the way into the ride), I was running of fumes and appreciated the short break at the top.
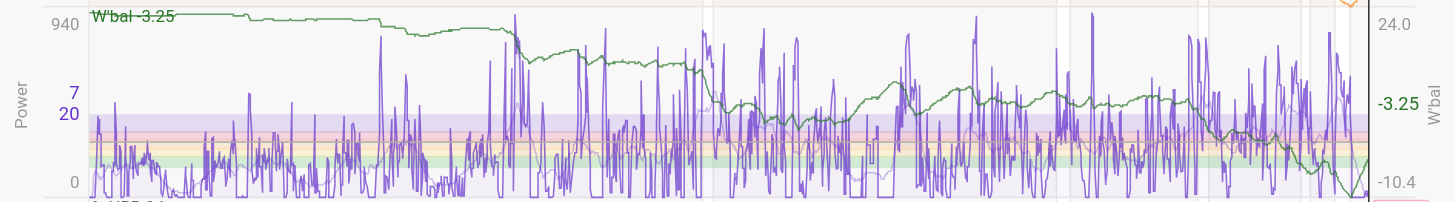
The minimum W’bal is at about 25 mins and is -10.4kJ. Needless to say, I emptied the tank in the sprint.
Both are rides with very bursty power output which is why I like the idea of plotting W’bal (vs. SS or other one-value-for-the-whole-ride), but it doesn’t make it obvious how to tweak the parameters (CP & W’).
I’d probably start with setting at 300W to see.
Thanks for the reply & suggestion.
I think I’ll do a 16km TT later this week before I muck with the numbers. The TT should take 25-30 minutes depending on wind, etc. and it should give me a bit more info about my FTP/CP.
There are 2 models, one differential and one integral. They act quit differently when it comes to recovery rate
W’ doesn’t take in account a long steady effort just below or at FTP. Try doing the same anaerobic efforts with and without doing first a 30min FTP effort. W’ to start with will be the same, but you will not be able to do the same…
It works well for progression follow up if you do the same workout structure with a series of VO2max or higher intervals. Or even one longer effort in the VO2max zone. But if you mix things up, these 2 structures will result in a different outcome. The one long effort is not dependent of the recovery rate, the series of shorter ones is. And the recovery rate in the model is a large population average, which you may or may not comply to.
I would not use it to guide you during a race unless you were able to shelter for most of the time and cruise along. Then you will have an idea what kind of effort you still have in the tank. If the race was hard all the time, it will not be reliable.
For follow-up, a structured workout with high intensity effort(s) will show if your W’ increased or not, but the absolute number is kind of worthless.
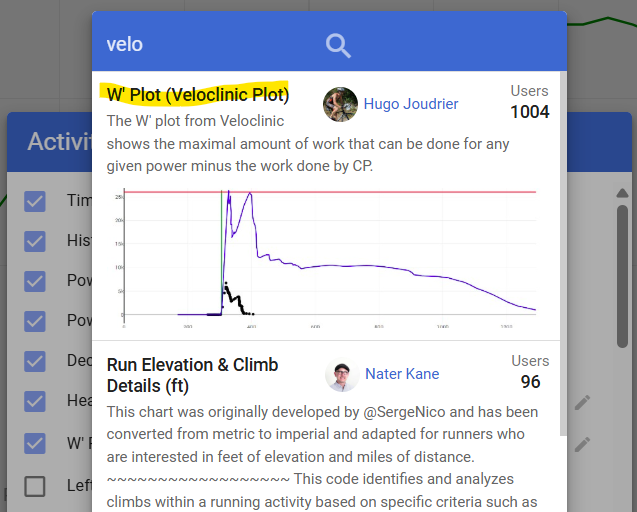
Thanks for the link to the other post, which then links to your other posts. I found the veloclinic write up interesting and I need to think about its implications. It seems like an indirect discovery of the 3-parameter (CP, W’, Pmax) model vs. the simpler 2-parameter (CP, W’) model.
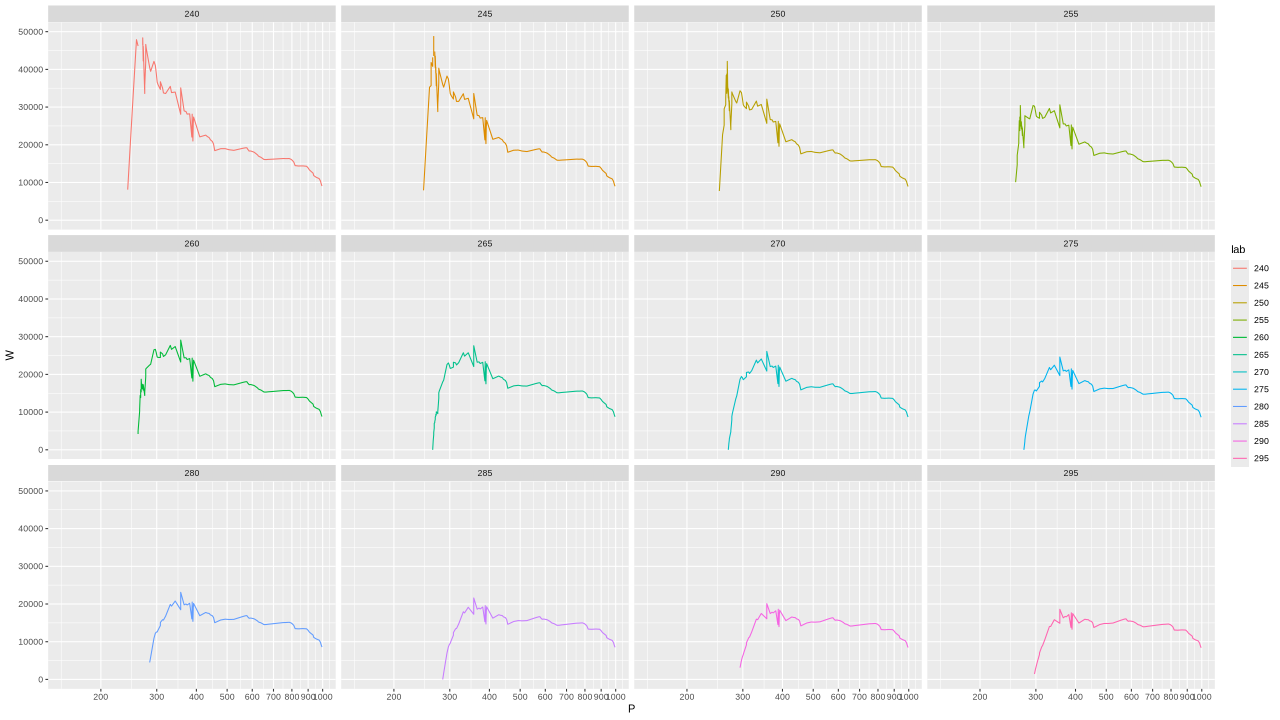
I just tried to experiment a bit by grabbing my current season power curve from intervals.icu and plotting different critical powers:
It looks like 255W CP has the correct shape and it suggests something like 28kJ W’.
I assume that at least one (and probably both) should be larger because I very rarely do a proper test for any duration CP and so my power curve is underestimating my limits.
Like I said, I’ll need to think about it (and mess with more data/plots, of course).
Thanks again.
For completeness, this is how I plotted it (using R + ggplot2):