W’ an FTP are connected to each other inversely.
If you were riding with your old FTP analysis number, and in reality your FTP was already higher, W’ will be inflated because it is the capacity above FTP.
After your test, resulting in a new higher FTP, W’ will always be lower.
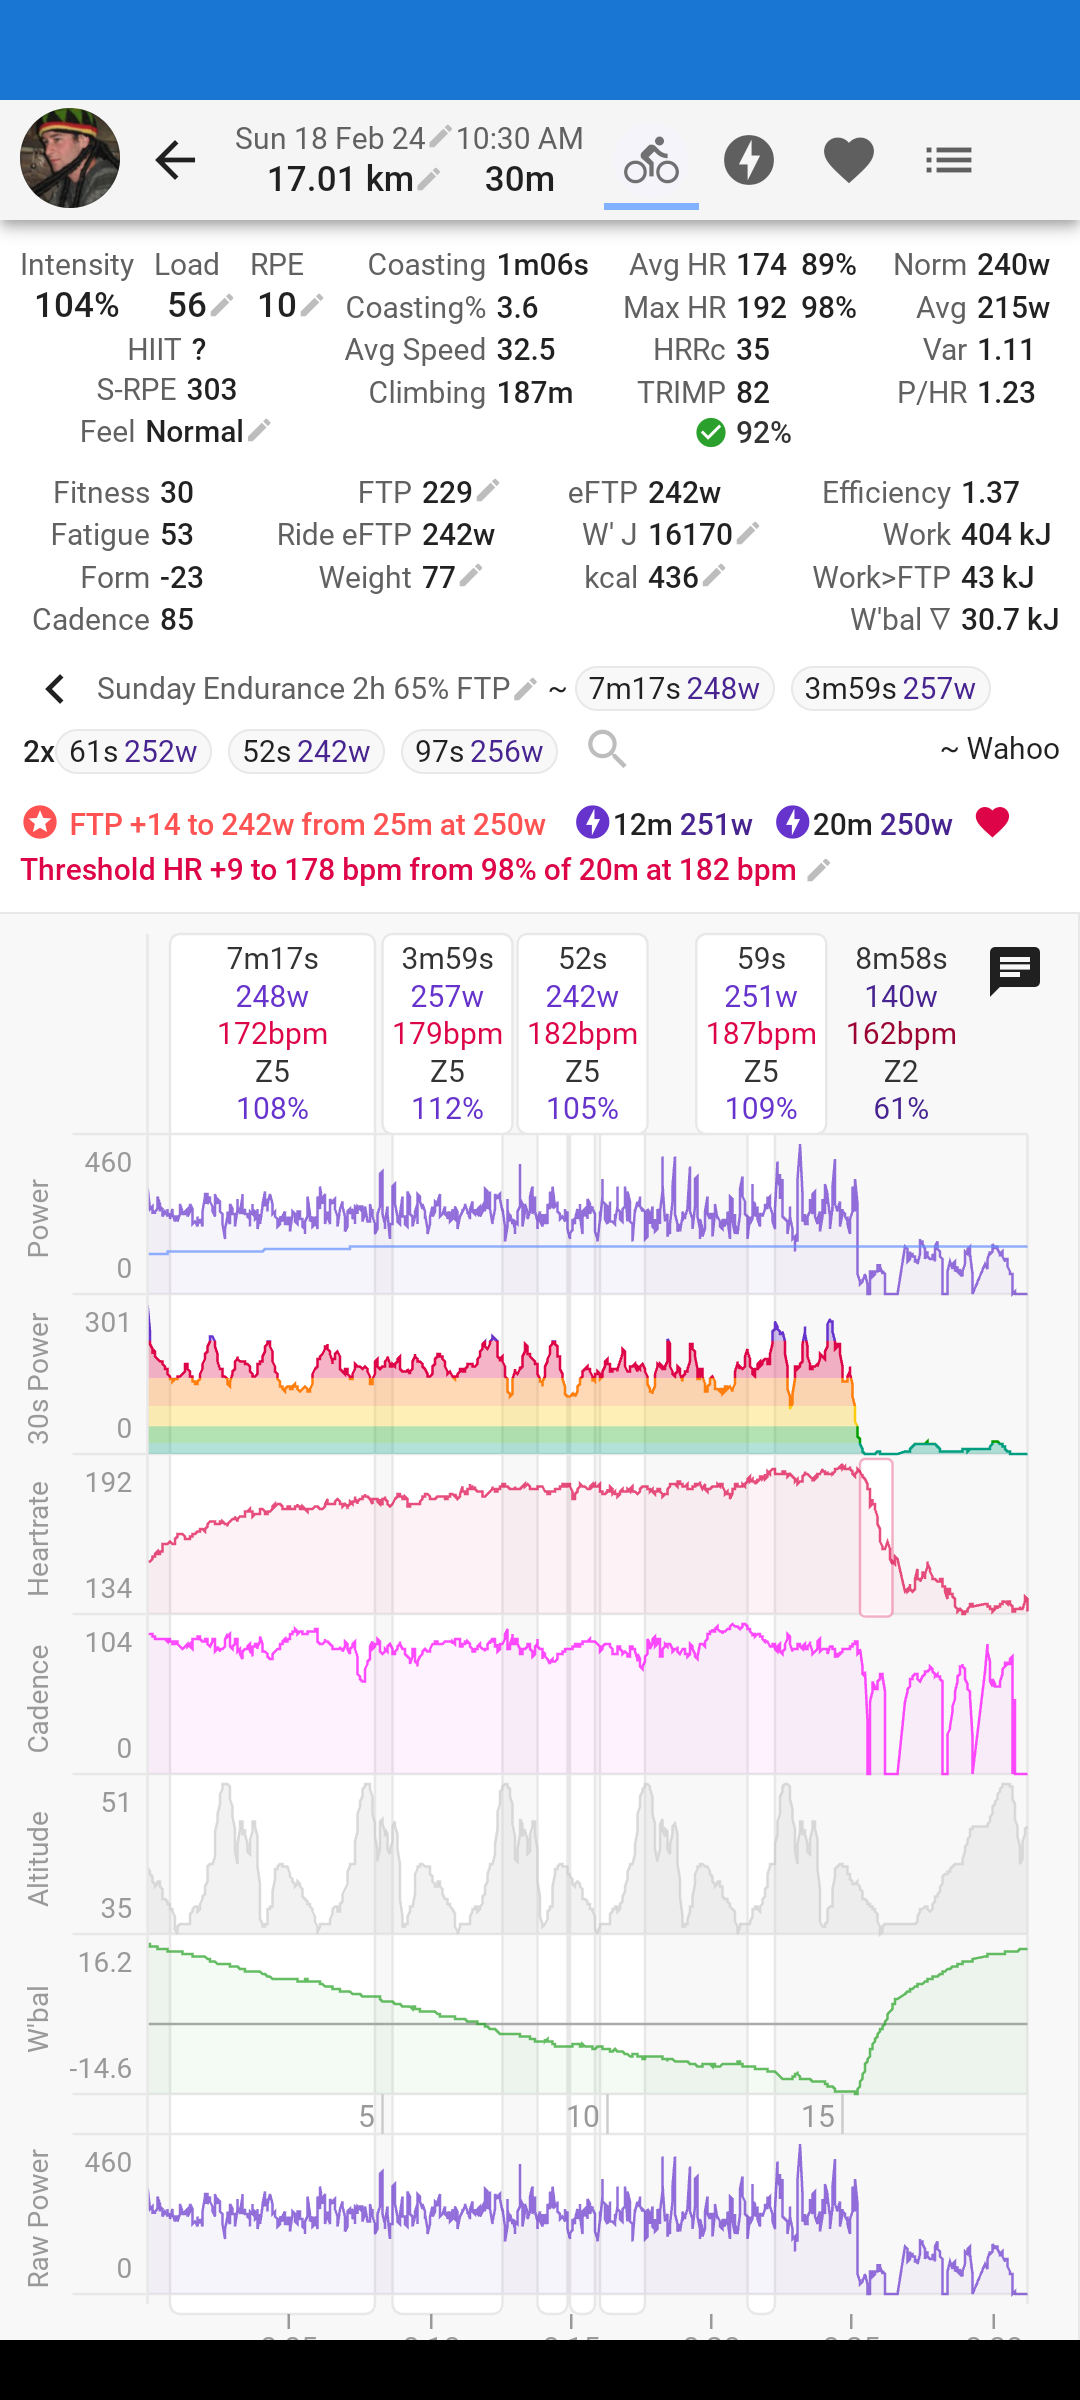
What you can do to ‘actualise’ your test ride is to apply the new FTP. Change the FTP for that ride to the new value that was detected. It’s at the top right of the summary on the activity page. This will reanalyse your ride with the new FTP value. Then check the W’ plot again with those new FTP and W’ values and you will get something more realistic. You might want to fine-tune the new W’ value by manually editing it in the summary until the plot shows an end-value around zero.
I’ve taken your suggestions on board and mode those edits to my ride data to produce more realist numbers.
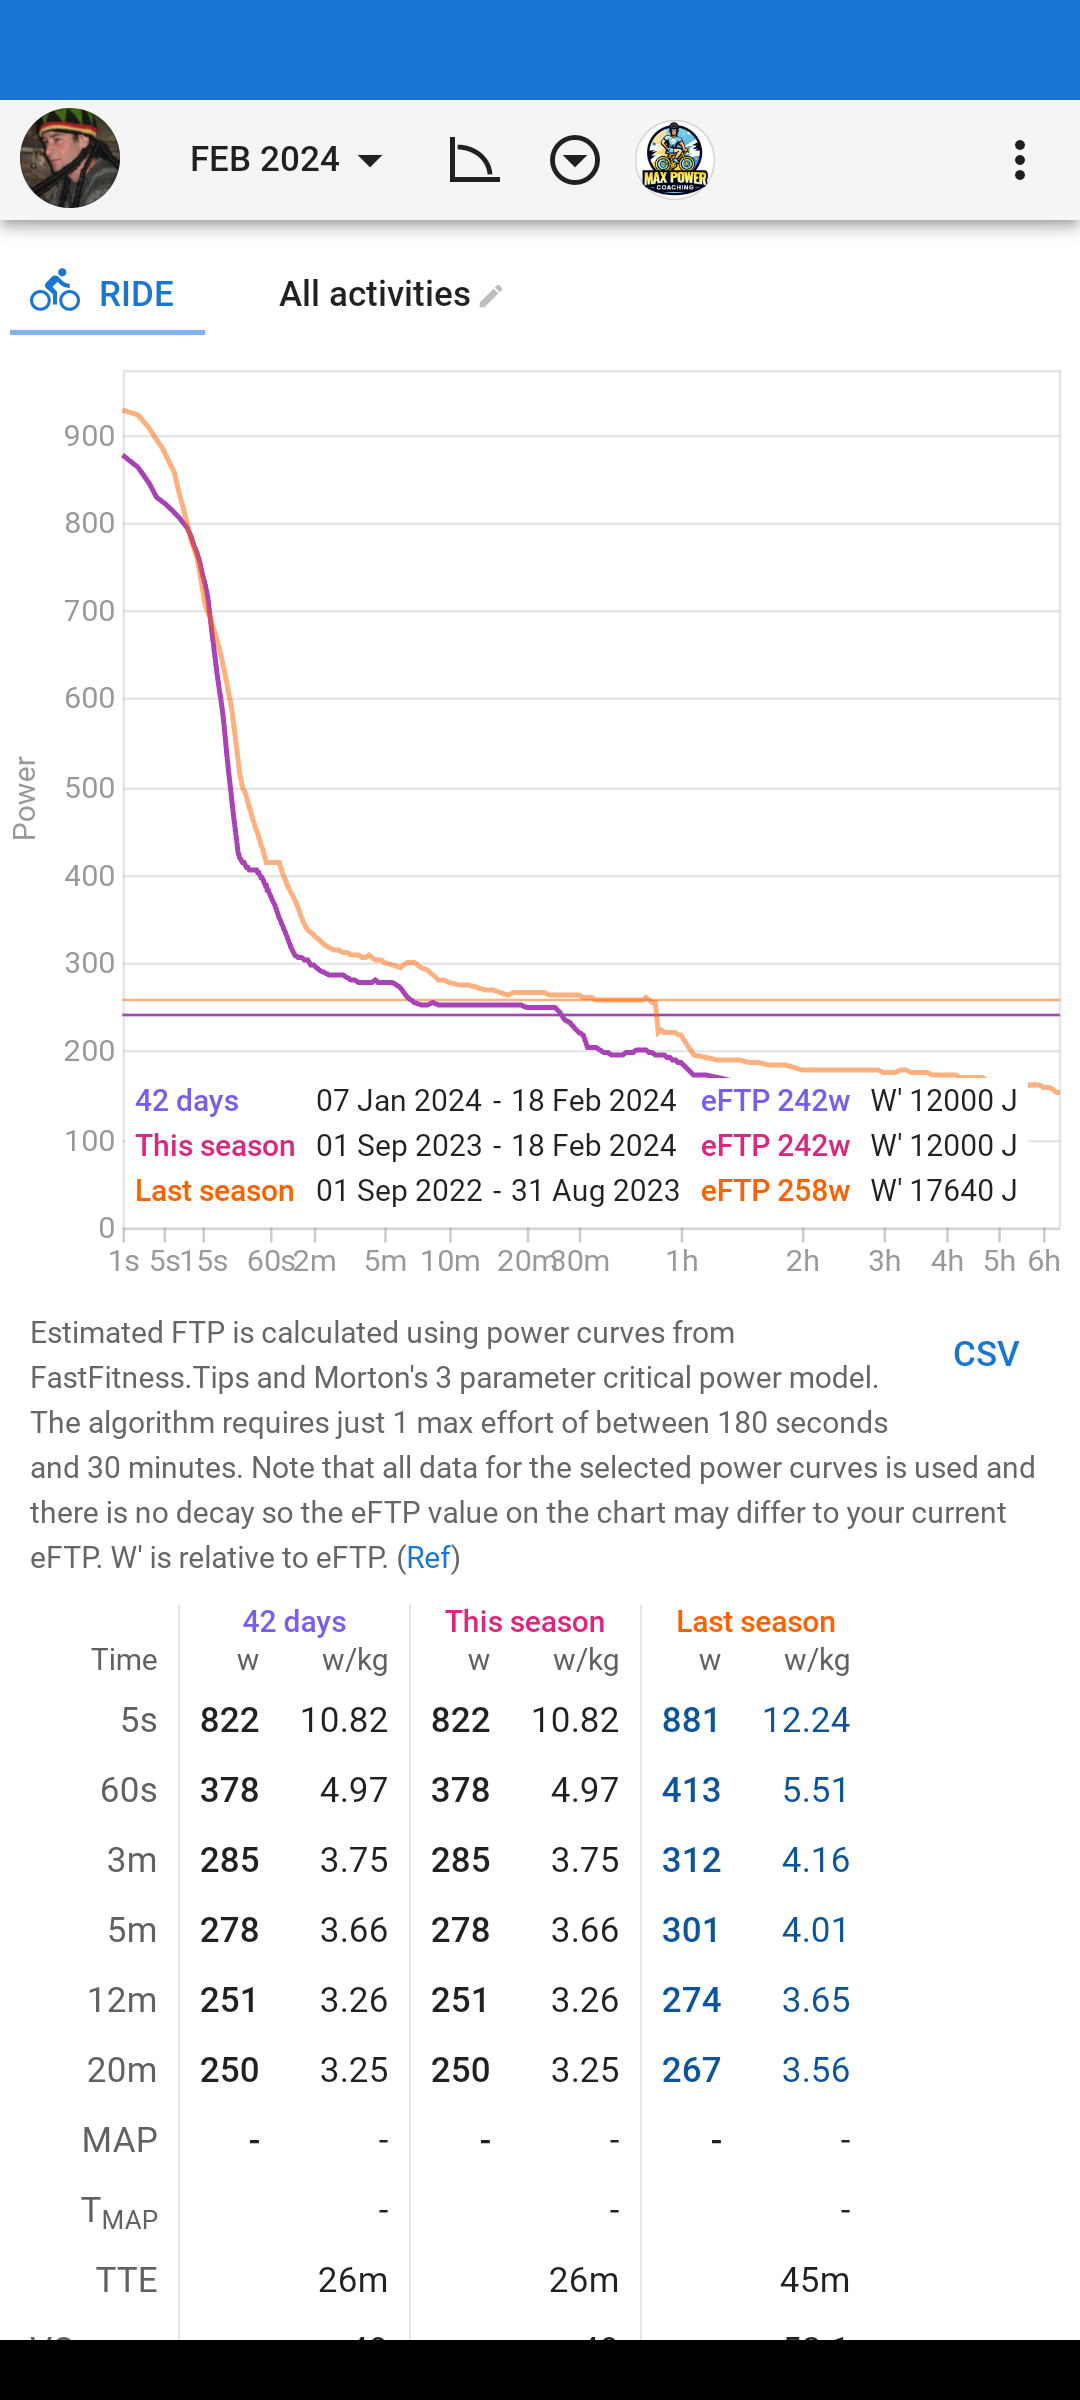
I was also wanting to understand the difference between the ride data W’ which worked out to be around 20700 after editing as you suggested and the estimated value on my power page of 12000.
Would you mind explaining further how this produces a lower W’ value on my power page?
The ‘estimated’ is what comes out when you’re PDC-curve is compared to a PDC curve from the database. If you have an anaerobic capacity that is significantly different from the ‘average’, be it higher or lower, W’ can be far off.
W’ is a metric that is difficult to grasp/measure and the results depend a lot on the sort of effort.
The topic has been discussed before on the forum,
And more…
An interesting custom chart, that might help you to understand better what your W’ is, is the Veloclinic plot.
Anyway, your original post shows that you are not fully understanding yet what W’ exactly is (no pun intended). It is a concept with lots of shortcomings and all together not that important/valuable. Don’t give it to much thought. It will not help you to improve training. Only when replicating the exact same protocol, it could show some trend longer time.
It does help to have it in the chart page, because you can see in the blink of an eye where a sustained effort above FTP took place.
You’re spot on in that my understanding is limited at this point.
Just to clarify why I’m asking these questions - I guess my curiosity gets the better of me whether it’s a metric that helps my training or not (or if I’m even trying to use it for this purpose, which at this point I’m not). I just find it to be interesting and would like to understand it more.
This is particularly the case if there seems to be some inconsistencies in terms of how this metric is presented. I like to try and improve my understanding so I can reconcile these perceived inconsistencies.
Again, I appreciate you taking the time to indulge my curiosity and provide some more context and background reading. It’s much appreciated