Hello
First post here and I’d like to share my thanks to David for this amazing resource! I no longer need to have a PhD in Statistics to use GC! And I am loving the Decoupling data.
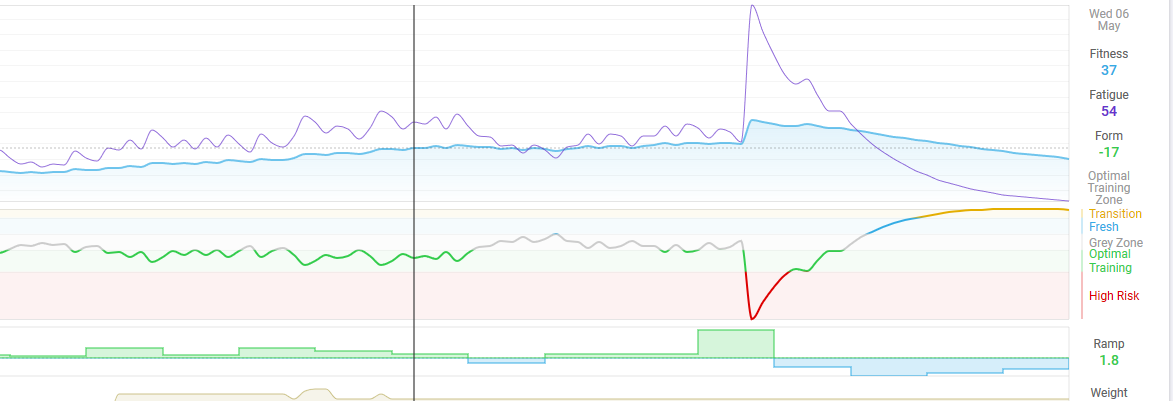
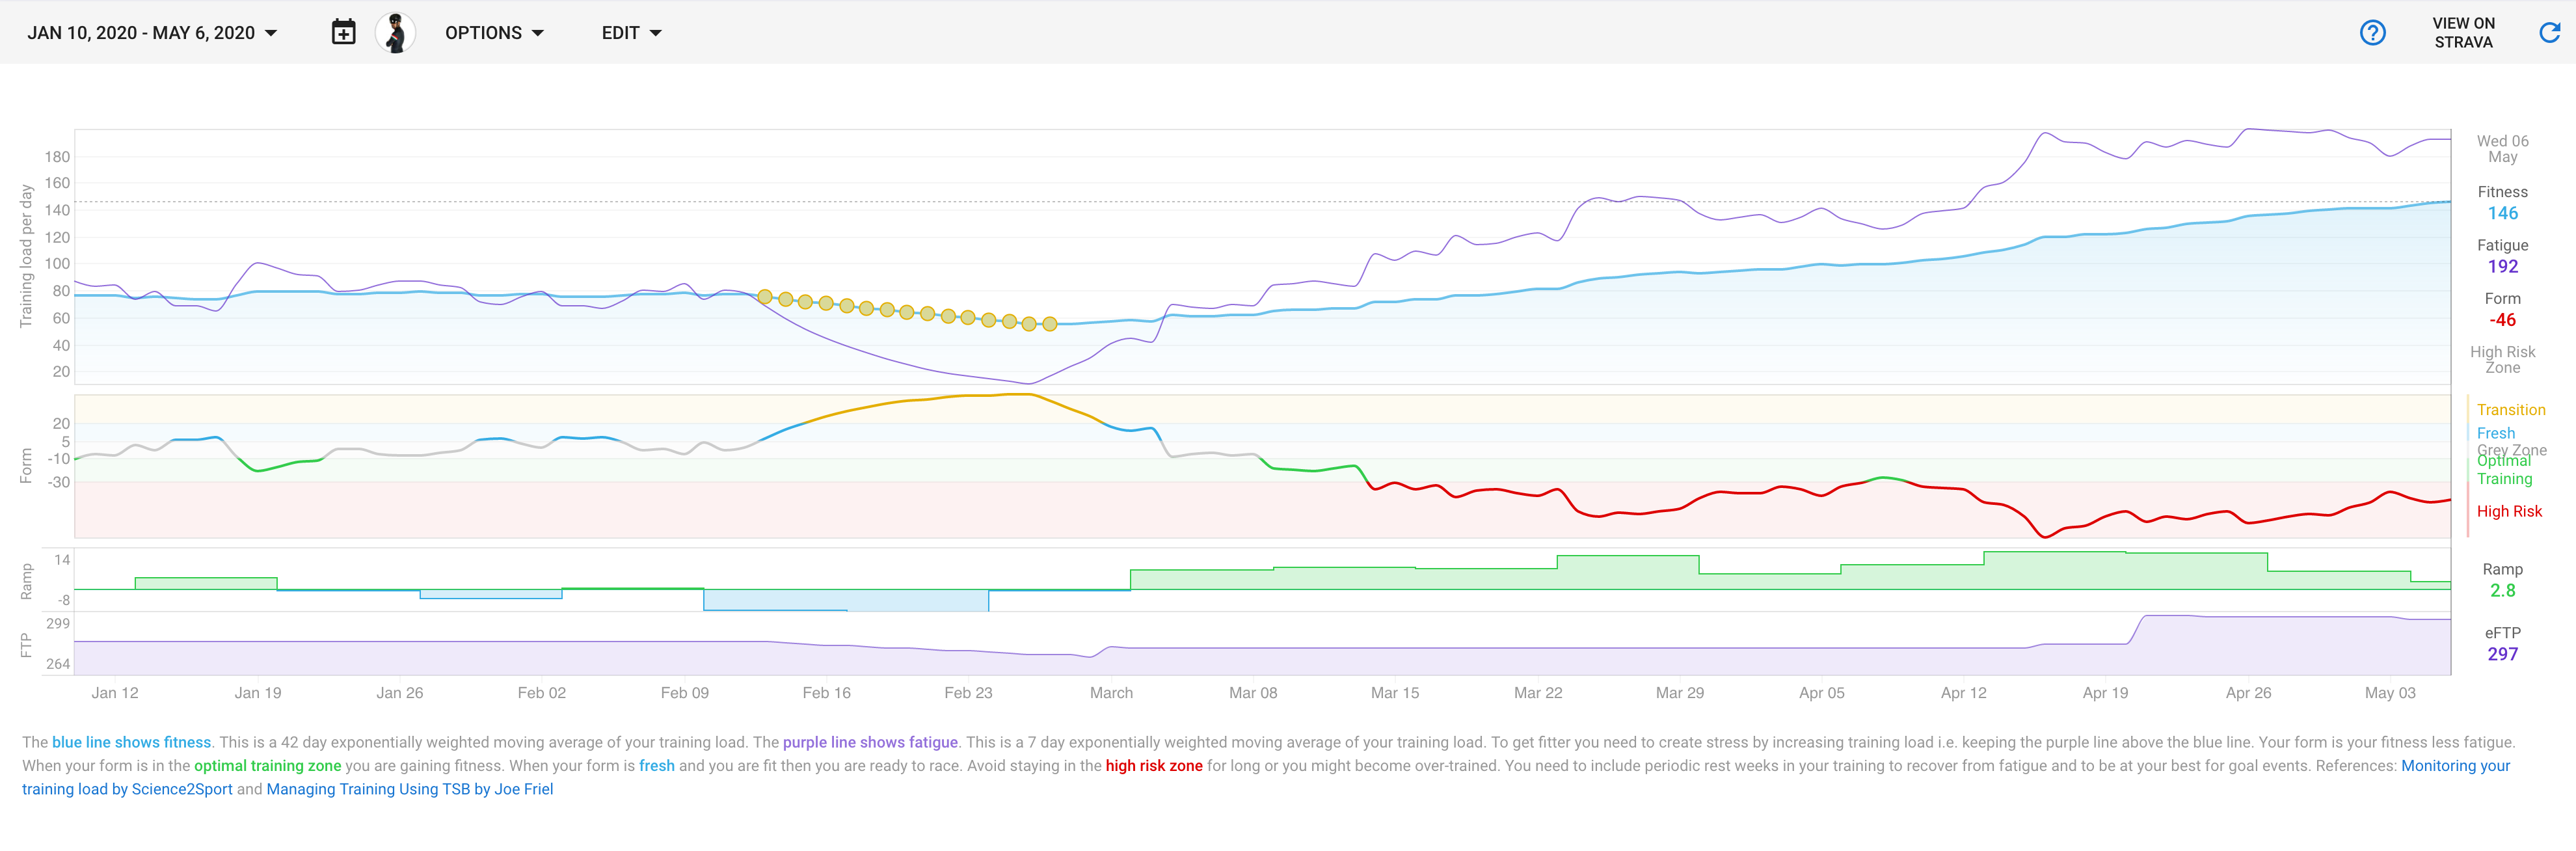
That is my current fitness chart, at the end of next week I would have completed Sweet Spot Base 2 and have a recovery week. I can see that shows as blue in the ramp rate. All good. I can also see my fitness line has trended up and fatigue trended down. All good.
However, after that I would be starting General Build with a Ramp Test then continuing on with the TR program. Looking at my ramp, it is rather shallow, as is the ever so slight upwards trend of the fitness line.
I also notice I am hovering around in the Grey zone.
I would have expected from the Build phase more training stimulus. Especially as I have added two EXTRA endurance rides a week too. All on the trainer with a pm. TSS is about 320 - 360 a week. Huge peak you can see is an event, which I doubt will go ahead!
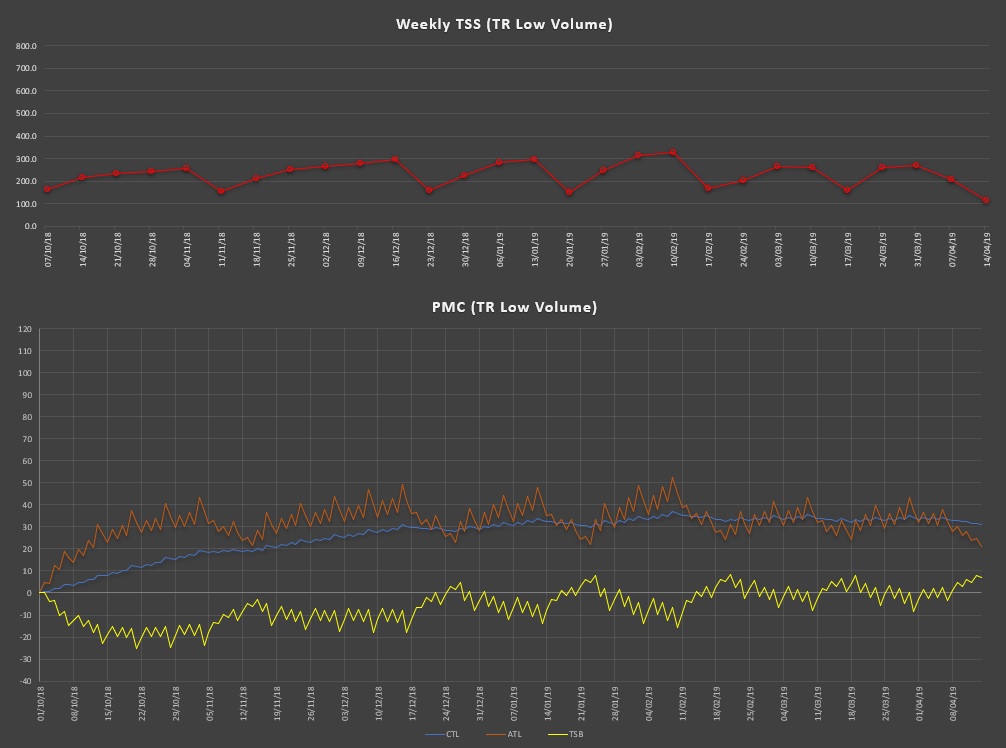
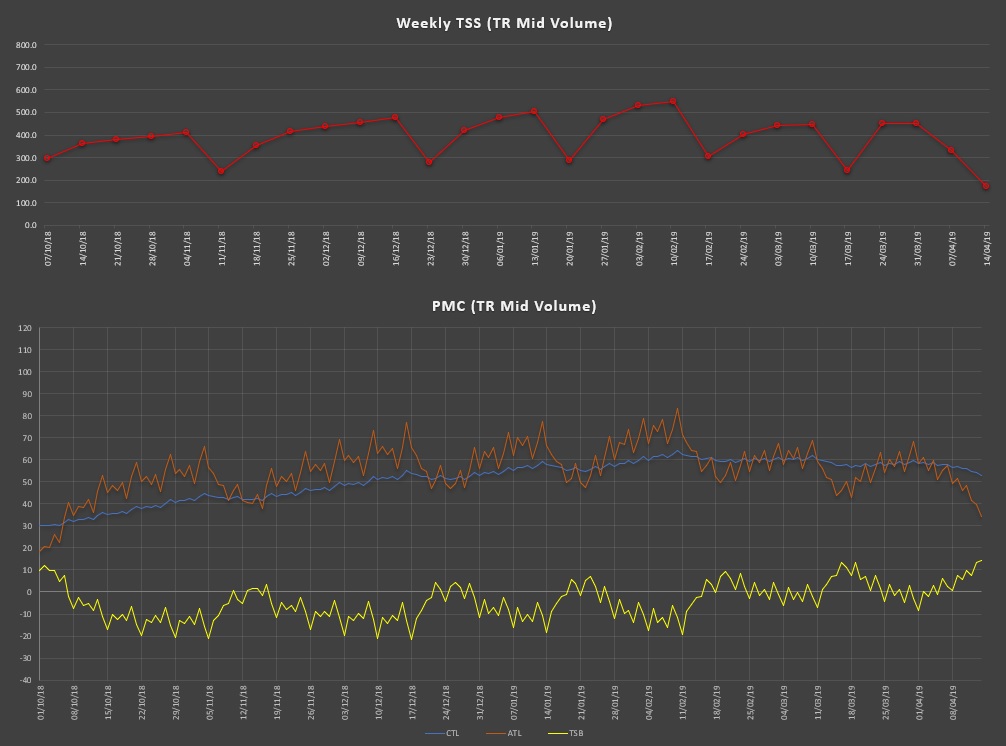
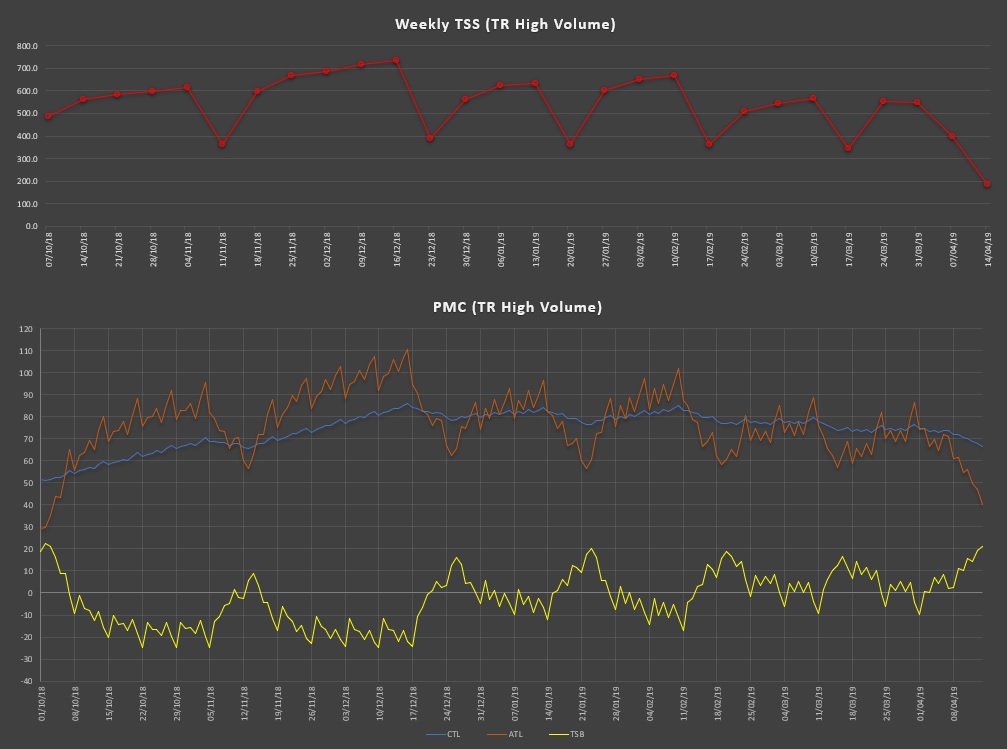
Are you doing Low, Mid or High volume? I have these plotted out on a PMC for each of the TrainerRoad plans as they exist.
Here goes… (Low volume starts at zero CTL ad ATL, Mid volume starts from the end of Low Volume and High Volume from the end of Mid Volume to give some realistic starting pointys fro each plan.)
Sweet Spot Base 1 > Sweet Spot Base 2 > General Build > Climbing Road Race - Low Volume
I actually think the TrainerRoad Build plans leave you much too fresh for long periods of time. It’s also worth noting that the Intervals.icu Freshness Zones are based on percentages of CTL for a rider with a much higher CTL than your own (around 100). I think it has been mistakenly implimented as a static zone.
I’ve been questioning why I have not long since collapsed. May still happen though But I actually see this about twice every year, when I’ve been building up…
So, I’m not a TrainerRoad user these days as I’m not super keen on how rigid it is. I like to mix and match and do what feels right on a given day so long as I’m increasing Training Load and using some sort of progression in the workouts. For that reason I moved to Xert a wee while back. That’s really neither here nor there but Xert does use a system where the freshness is determined as being in one of 4 zones:
Detraining (Above 60% of Training Load)
Very Fresh (Between 30% and 60% of Training Load)
Fresh (Between 30% and -30% of Training Load)
Very Tired (Anything below -30% of Training Load)
There is another zone: Tired, which relates to other parameters in the system and this can be anwhere from 100% down to -30% of Training Load.
I actually think training between 0 and -30% of your CTL is a good guideline no matter what your CTL is.
Hmm. I actually was quite far down the line with changing that to support % option but rolled it back. I might revisit that. My CTL usually around 70 or so and the fixed zones work ok for me. So I was going to use 80 CTL to translate the fixed zones into percentages. Obviously 100 would be easier.
I plan to add an option to “Show form as percentage of fitness”. So if your form is -10 and your fitness is 50 then it would be -20%. This will cause form to be displayed everywhere for the athlete as a percentage. The form chart will also have percentage bands when this is enabled.
The other way to do this is to look at the ratio between fatigue and fitness (TSBr = ATL * 100 / CTL in TodaysPlan I think). But I think just using a form% is easier for people to understand and has the same result.
Yes, I’m doing Low Volume, but have been adding 2 extra rides a week as I’m working from home and have more time.
Those graphs look like they are from GC, is that correct? I’ll have to pick your brains about how to add a training plan…
But back on topic!
The trend looks the same on the first half of General Build as I have seen on my chart. I’ll remove the event and add in the second half and see what it looks like.
Thanks for this link, I do need to do some more reading on this topic.
Just wondering from my graph, is it telling me I should be doing more? I’m averaging 360 TSS a week on the turbo.
Essentially it’s just looking at TSS per week. Are people really doing that much volume to push into the red zone?
Actually, I’ll need to read the linked blog before I make assumptions!
They’re actually from a spreadsheet I have. I can send you it if you want - just send me a PM with your email address. It allows you to quickly add TSS on specific days to see what changes that makes.
I have done some reading in the hope of understanding the CTL, ATL, TSB charts. I still have a questions though.
I understand how the three tie in to each other, but I am failing to see how is mathematically possible to increase CTL score if you do not increase daily TSS. @Mike_Lauder was kind enough to send me his spreadsheet, so I mapped out a Base Build Specialty plan, and then repeated it. After the first round of training CTL ends up at about 35. If I was to do Base Build Specialty again, CTL is 32 at the end of the training plan.
Can someone kindly explain where I am going wrong please? Through out the two cycles, I would have done 6 Ramp Tests, my FTp would have gone up, so I would have been putting out more and more work as the plans progressed.
I read I need to ideally keep Fatigue higher than Fitness to promote an increase in Fitness. But going by what I have tried, that seems impossible.
I think your math is correct. You can progress, raise your FTP and use it to compute the TSS such that the CTL in the end is not any different. But if you did not update your FTP setting, this would look like you are doing more and more TSS — and CTL would grow.
Assuming that you are good at doing the tests reliably, the argument about Fatigue>Fitness should apply in between the tests (=updates in your FTP).
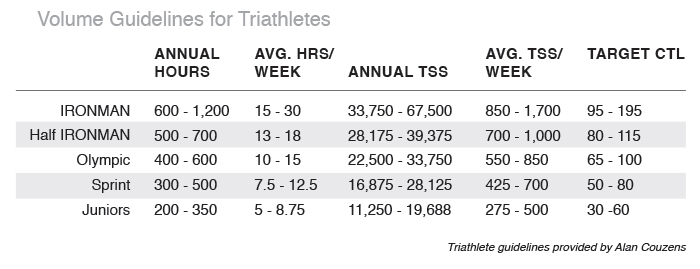
CTL is not something that should grow and grow — the level at which you should peak is related to the kind of events you are doing. For example:
Andrew, your math is is correct, as Andril said. There are two separate things to keep in mind:
[1] the amount of work you do ~ total watts * time ~ total kJ. As you work at higher intensities because your FTP goes up, for about the same length of time, then the amount of work goes up. You will be doing more work over time.
[2] the training stress ~ the amount of work you do relative to your ability to perform work [aka TSS]. Think of this as the amount of work divided by FTP. This is intended to be a measure of the stress you are putting on your body, so it’s work relative to ability to work.
Now, can you see how total work can go up but stress [TSS] remains more or less constant?
This is what was missing in my understanding. I imagined it should continuously increase. I found the rest of that table you sent, makes perfect sense now. And gives me a TSS to aim for for my event.
Yes this is what was confusing me. Thank you for fact checking me, glad I was on the correct path!