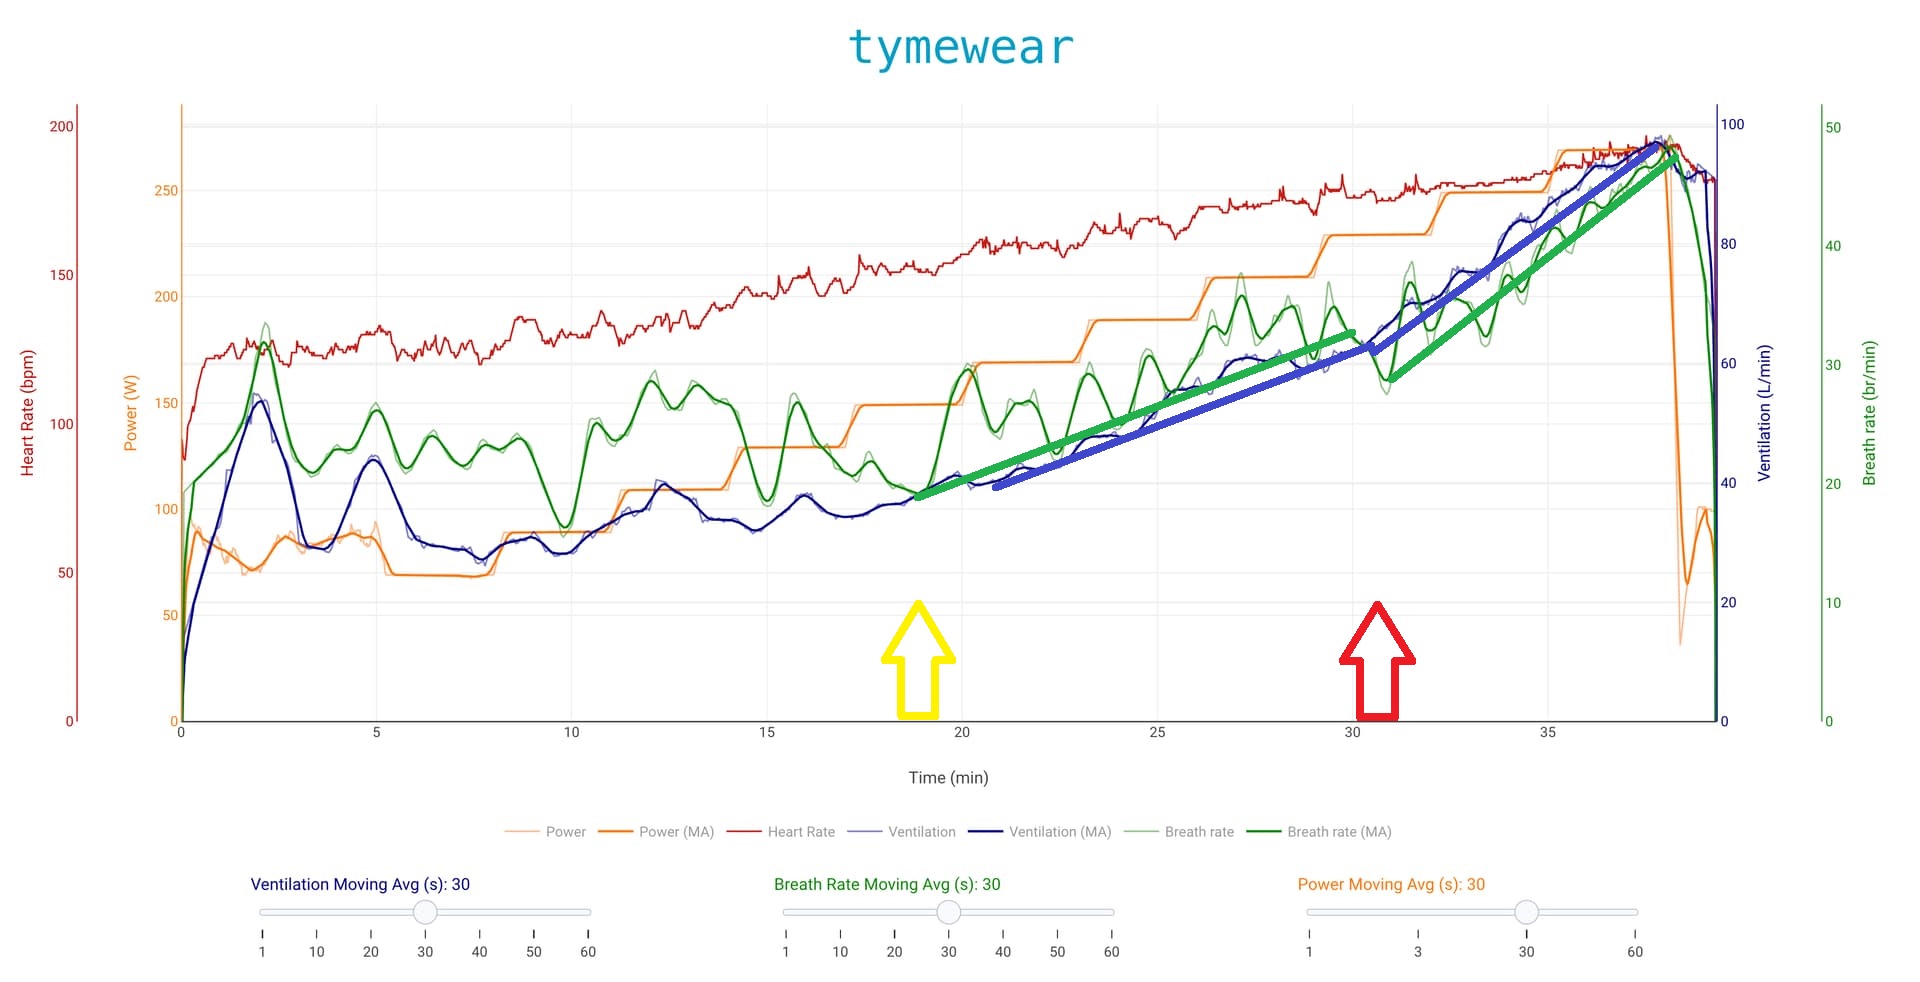
For testing, breath normally, do not force breath rate. And start analyzing when there is a trend up in breath rate / VE (moving averages up, higher lows).
For training, that irregular/untrained breathing with no trend is < VT1
1 Like
Thank you, that makes sense!
VT1 (First Ventilatory Threshold)
-
Tidal Volume (VT v/br)(tidal_volume) : Rises steadily. Its rate of increase slows and it starts to plateau. It no longer contributes much to the rising V̇entilation (VE v/min)(tidal_volume_min) .
-
Breath Rate (respiration): Is now the primary driver. It begins its first sustained, linear increase. This is your key marker.
- Before VT1: Breath Rate (respiration) is variable but flat.
- At/After VT1: Breath Rate (respiration) establishes a clear upward trend. With higher moving averages and higher lows
-
V̇entilation (VE v/min)(tidal_volume_min) Shows its first clear increase in slope. The rise becomes steeper because Breath Rate is now adding to Tidal Volume’s contribution.
-
VT1 is the point where Breath Rate “locks in” and begins its systematic climb.
VT2 (Respiratory Compensation Point)
-
Breathing Rate (respiration): Shows a second, much steeper acceleration. The increase becomes exponential. It is now the dominant driver.
-
Tidal Volume (VT v/br)(tidal_volume) Often peaks and may even decrease slightly as breathing becomes rapid and shallow. Its plateau ends.
-
V̇entilation (VE v/min)(tidal_volume_min) Shows a second, very sharp breakpoint. The slope increases dramatically, forming an almost “hockey stick” shape.
-
VT2 is the point where Breath Rate surges and Tidal Volume can no longer keep up.
8 Likes
Do you make sure that your clothing is not interfering with the tymewear measurements? Esp. if you wear the chest strap underneath (opposed to above) the bib for the outside rides make sure that the pod is off to the side and not influenced by motion/stretching of the bib’s shoulder straps.
2 Likes
“analyzing raw FIT-file HRV data and did not find clear errors.”
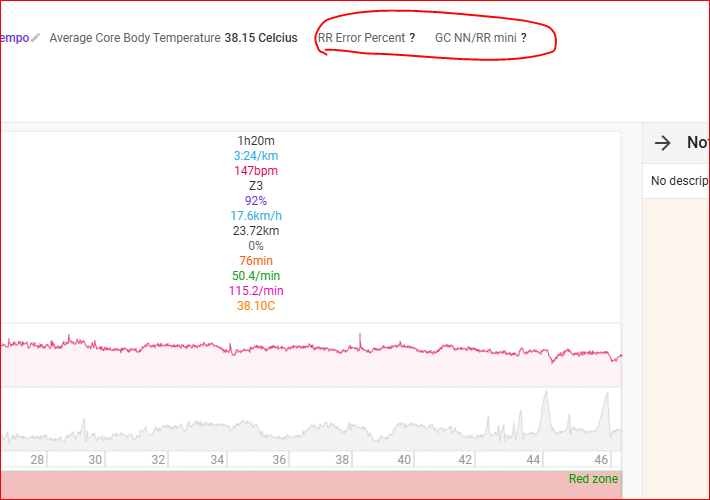
There is this NN/RR Percent Activity Field, that helps with that.
1 Like
Plotting RR-intervals shows artefacts immediately as you can see from the second chart in underneath screenshot. Dots above the trendline indicate missed beats (1). Dots at the bottom indicate false beats.
Pairs of outliers (2) can be caused by artefacts or noise, but can also be anomalies like the ECG trace (top trace) shows in this case. This is an ‘APB’, premature beat where the p-wave is ‘missing’ (usually drowned in the QRS complex). Pay attention to the short/long RR interval in this case.
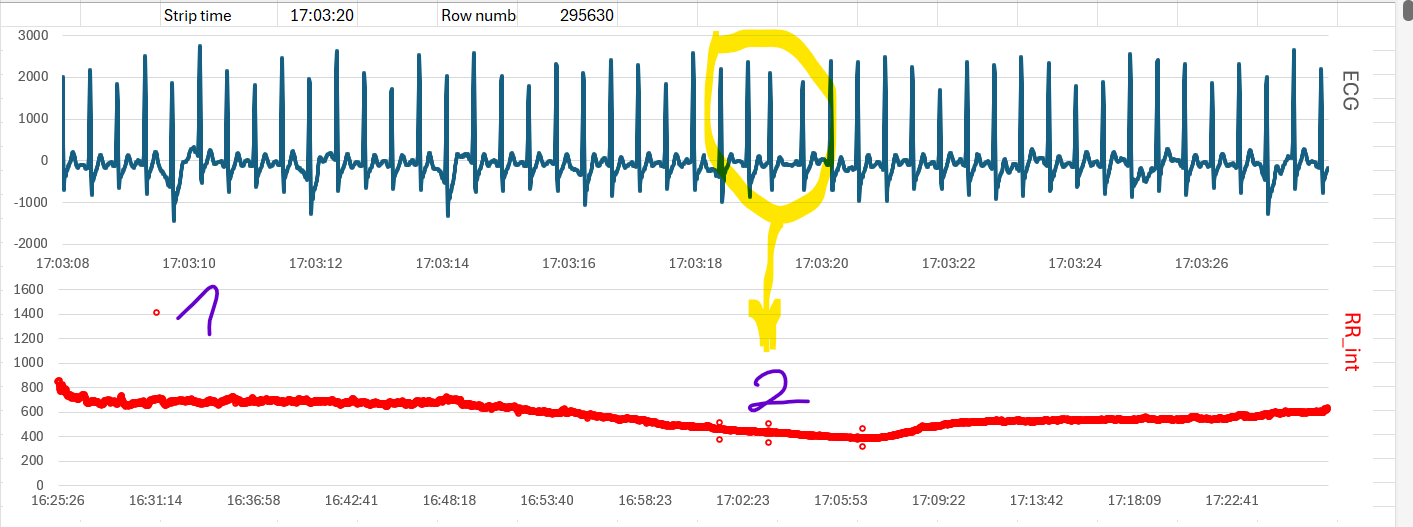
During indoor test workouts, I have the habit of recording single lead ECG from Polar H10 with phone app ‘Polar Sensor Logger’. But simply plotting the RR-intervals from Garmin HRV will give you a good indication of the signal quality.
1 Like
But nothing like the convenience of RR errors %, as a number, as an Activity Field, to track the activity HR record quality.
This was a feature that I missed as a FirstBeat Athlete’s old user, when I started using Intervals.icu. So I created this Activity Field.
1 Like
I this custom field using the HRV array recorded on Garmin devices that have HRV enabled?
Yes, you have to enable HRV logging on watch
How can I add this “RR errors %” data field to intervals?
Open an activity and in Custom search Field for “RR error” or “NN/RR”. Select, and then in Actions, Reprocess and Reanalyze activity.
2 Likes
I think @Timur wants it as an interval field too and not only as activity field.
1 Like
It will only work if you have the RR intervals in the Fit file, so check if HRV during exercise is enabled in your watch/head unit.
1 Like
Yes it’s those Activity Fields. Don’t forget to Reprocess and (Re)Analyze that activity.
But as MedTechCD said, only works if activity contains Garmin Fit file style HRV data, i.e. activity contains icu.fit.hrv data.
1 Like
Thanks @pepe This helped. I reprocessed the marathon results and got the data.
RR Error Percent 0.67%
GC NN/RR mini 94.4%
How reliable are they? I mean, can I consider the heart rate data reliable for this race?
I also looked at the data from my last 15 km race (where I did not observe any issues).
The data are as follows:
RR Error Percent 0.64%
GC NN/RR mini 96.7%
Yes, and the following workouts show the same patterns as well. Thank you.
Can you try also “NN/RR percent” Activity Field?
And by the way what’s your HR monitor ?
Can you try with different HR monitors like Polar H10 or with a Garmin HRM Pro Plus/HRM 600?
1 Like
NN/RR Percent
Metrics from the marathon TymeHR strap 94.22 %
Metrics at the start of the 15 km race Garmin HRM-Pro Plus 98.78 %
Metrics from today training session TymeHR 99.63 %
Perfect. In your case aim for NN/RR value of more than 98%, this value is always individual, as skin conductivity and other factors vary from person to person. 94.22 % seems a low value.
2 Likes
Just update “NN/RR Percent” Activity Field, new array optimizations, now almost 50% faster and able to process 50% more HRV datapoints.
1 Like