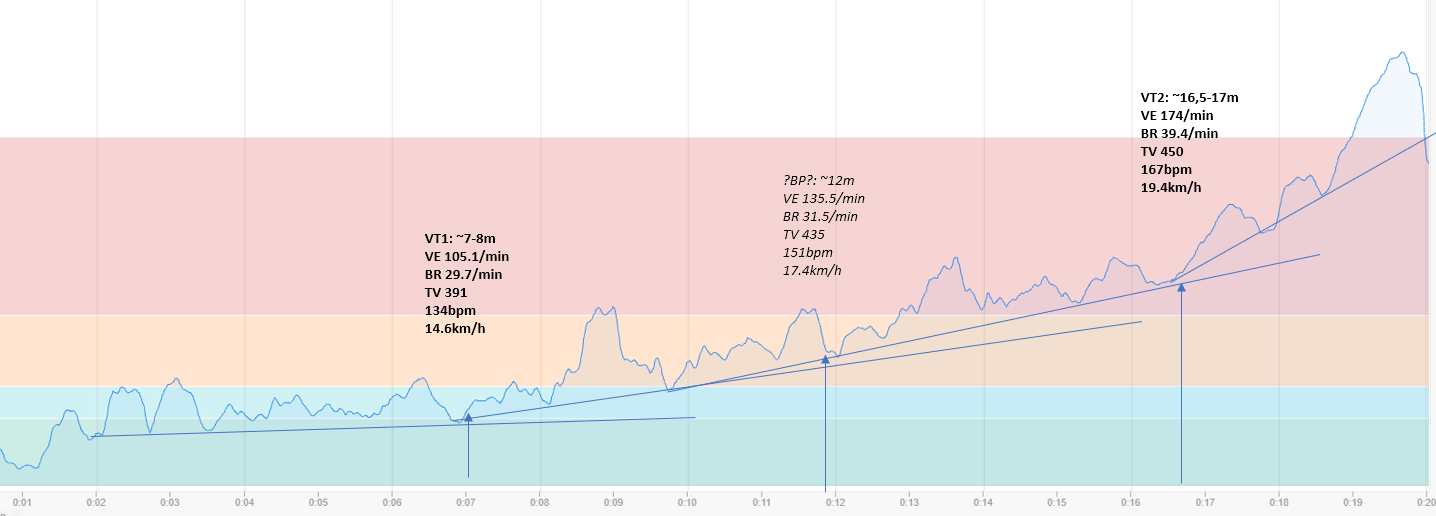
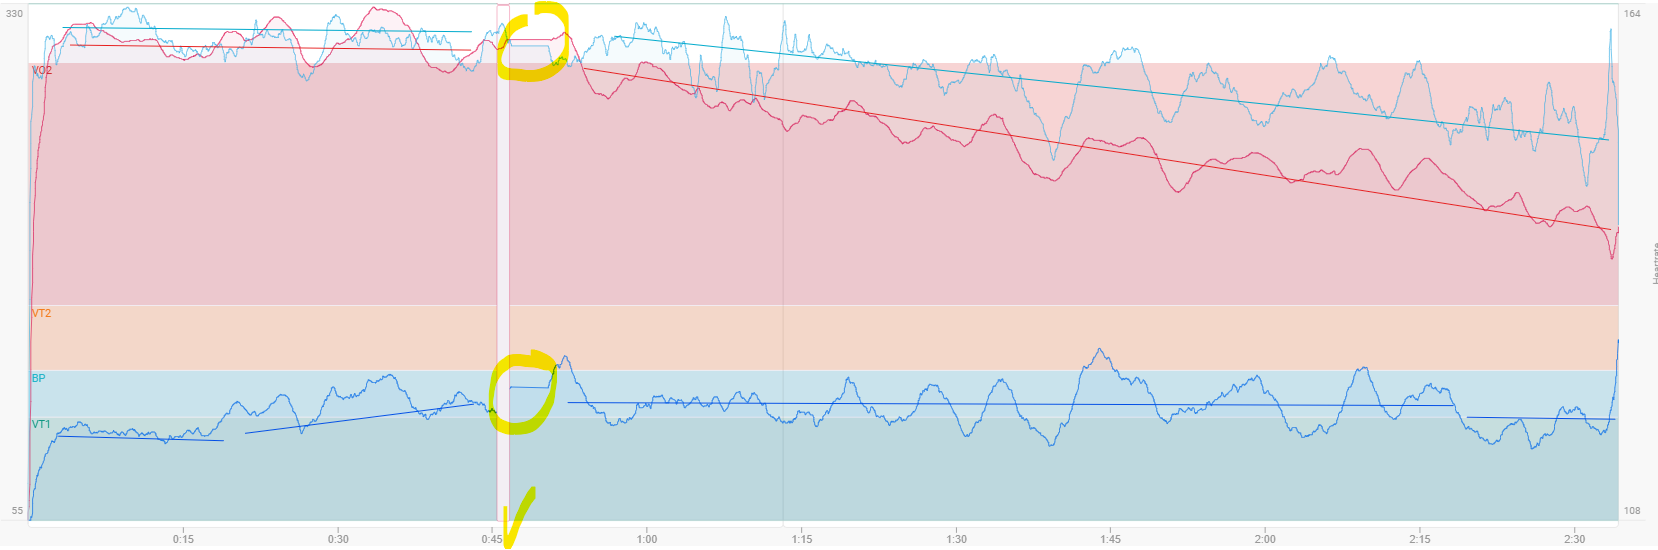
VT1 8m, VT2 17m
1 Like
Bingo! Indeed, it’s very close—so close that even a simple glance is enough to see where the metabolic pattern changes. As I mentioned, I relied on RPE here, and it correlates very well.
An open question is how to determine the BP (FatMax) point.
If more confirmation is needed, I then had a 15 km ski race. That effort is comparable (probably slightly easier) to a 10 km run—so right around the LT2 / VT2 zone. Moreover, I finished with some reserve, since it was a control race, not an all-out effort.
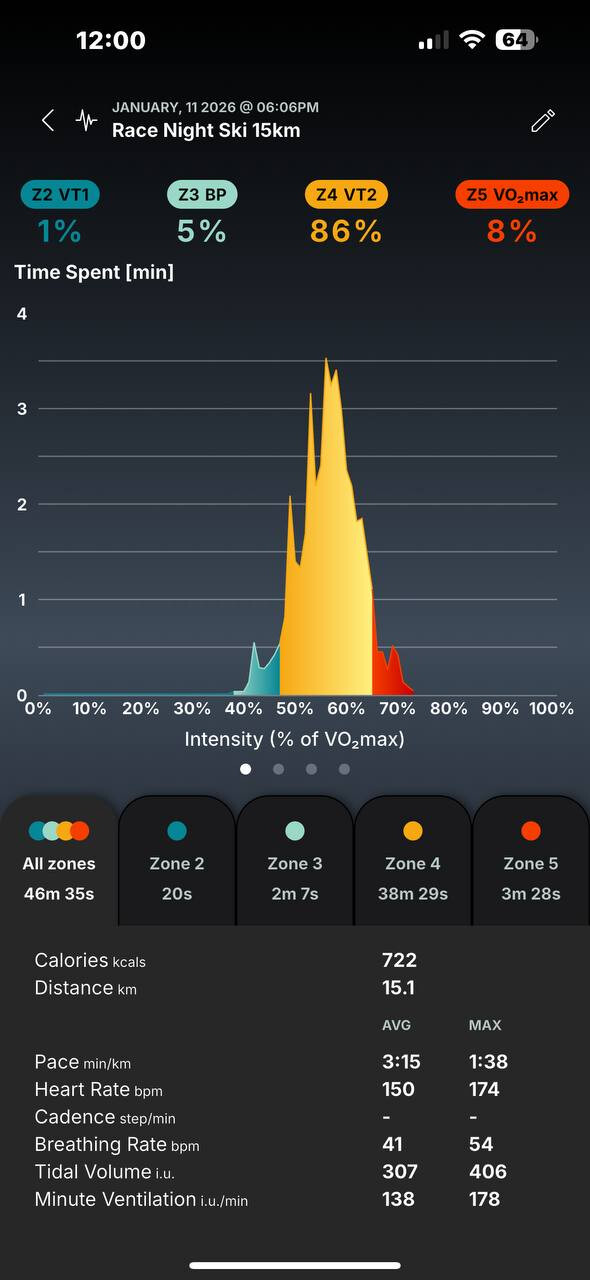
My average VE over 46 minutes was about 140, with an average speed of 19.3 km/h
2 Likes
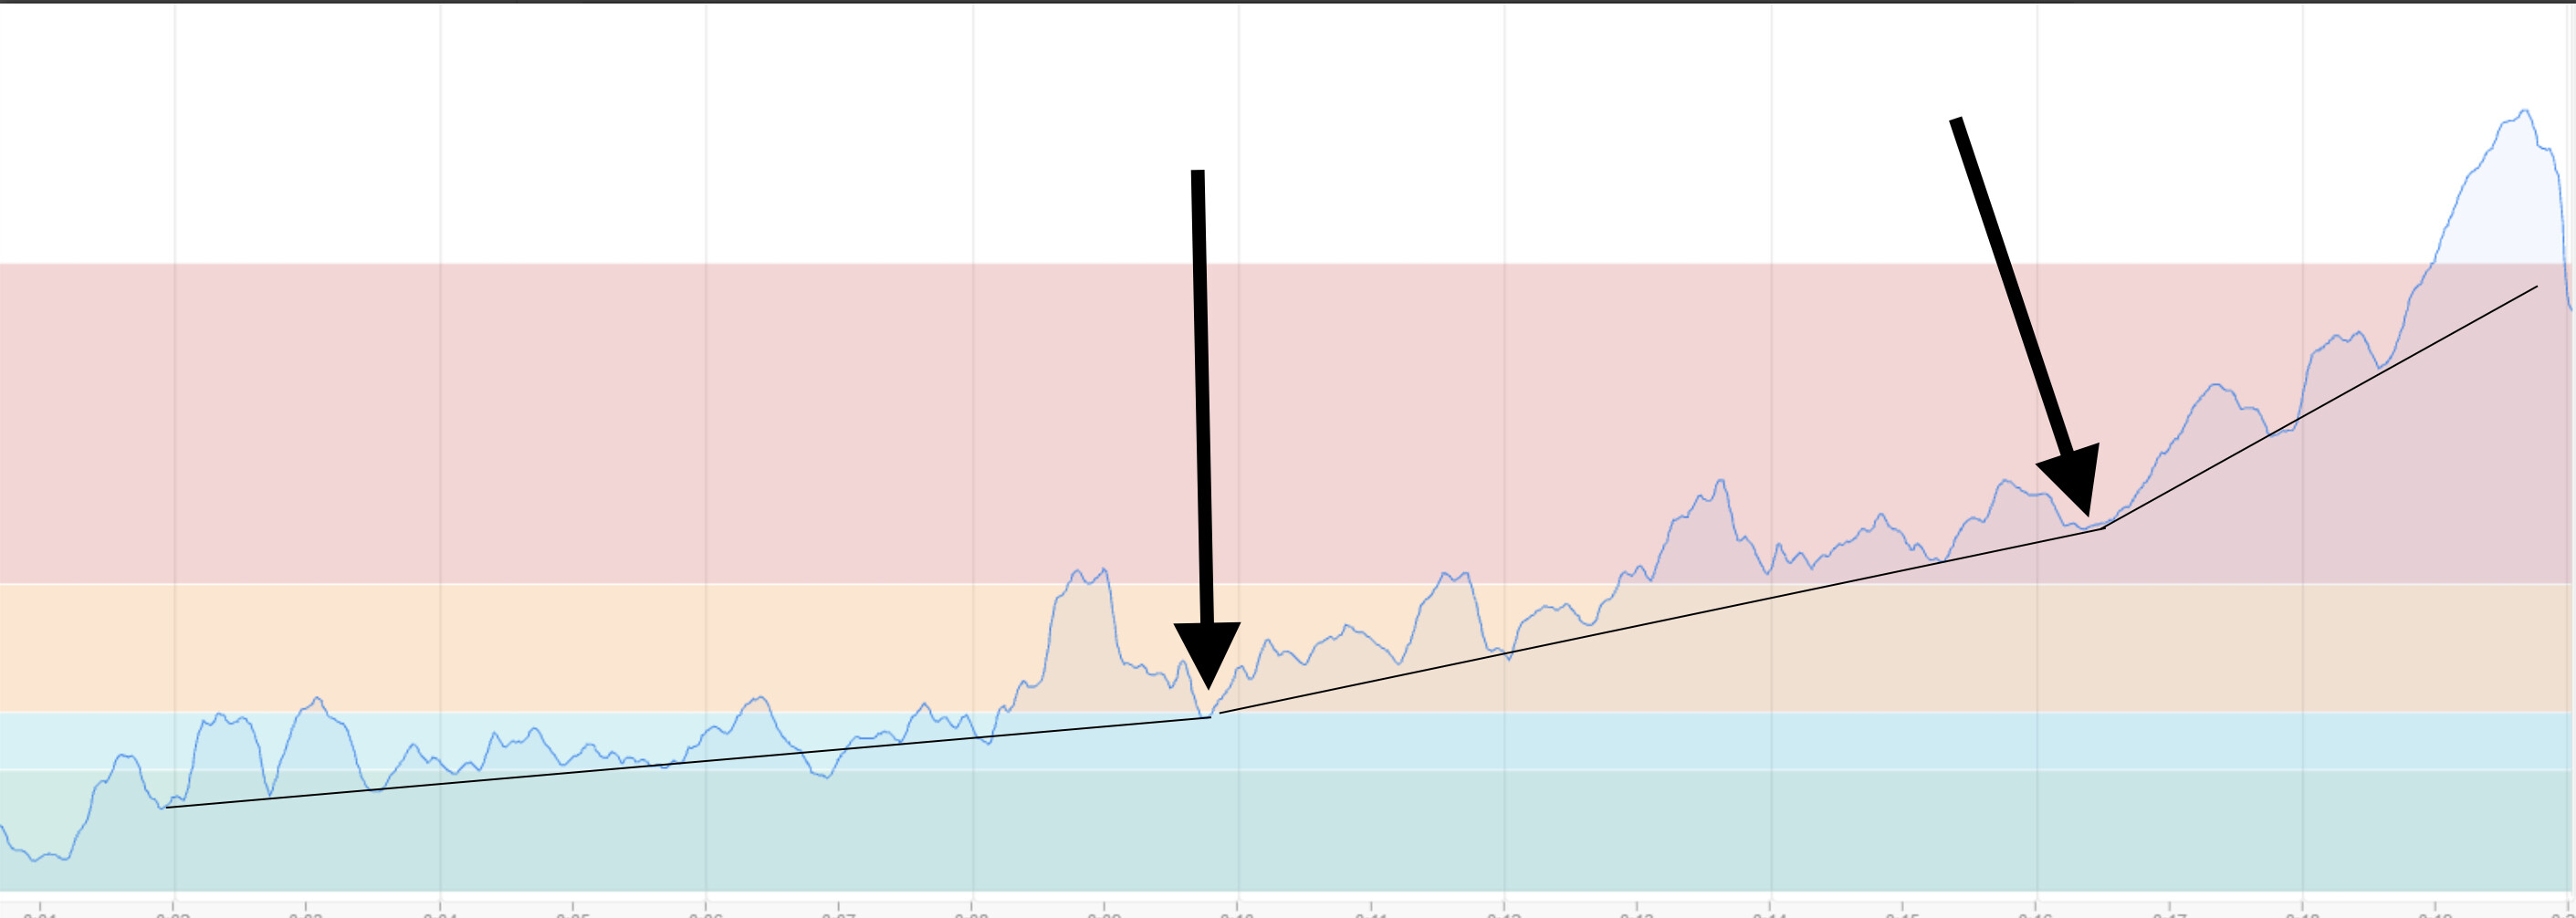
Is that pattern with the lines you drew in (i.e., flat line < VT1, moderately sloped line < VT2, severely sloped line > VT2) the effect that’s basically always there? Or is this graph just the best case scenario, and other activities (or other persons) are more unclear in this regard? I mean the image you show looks quite convincing…
Normally yes, but lot’s of people start the test at an intensity that is too high, so they miss VT1 or it is so close to the start that you are not able to see it.
It’s like lactate testing, start very low and even keep that low ‘steady’ for at least 5 min, better 15-20min.
If all is done correctly, you will see 3 regions with a more or less clear difference in slope.
3 Likes
MedTechCD Exactly. There’s really nothing to add here. It’s the same with lactate testing—you need to start with enough margin to capture the minimal values.
Another_Intervaler
This is an example from a bike test. Ventilation values are different, but the key is starting easy enough to clearly see the curves
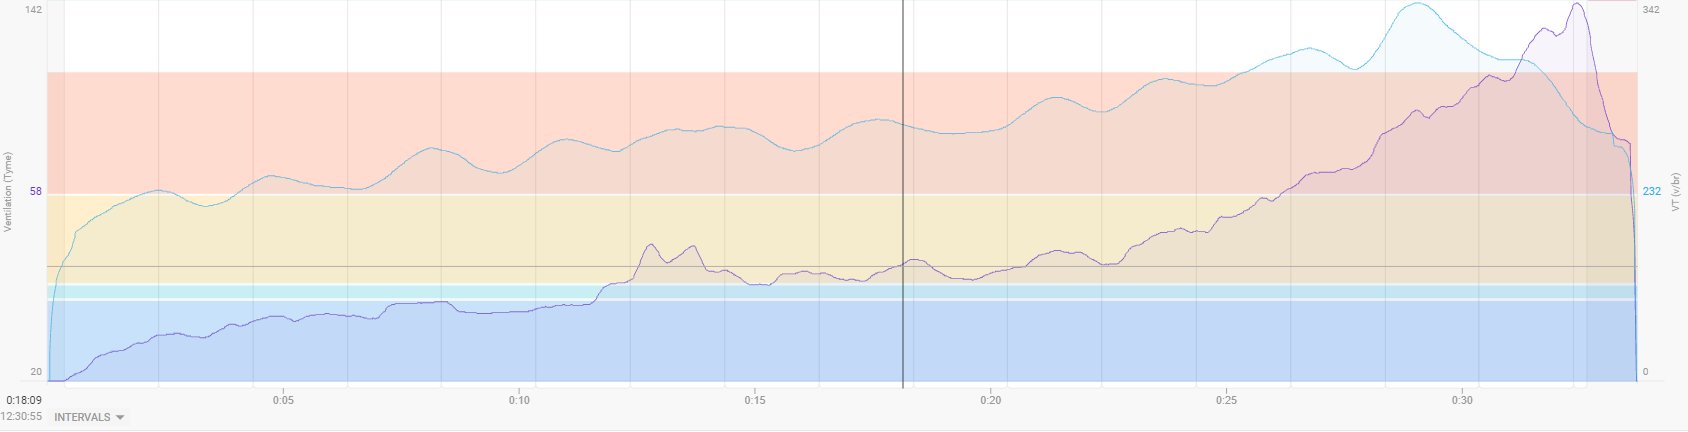
Maybe just this to be fully transparent:
You will see this pattern for Lactate, RespRate and RPE.
You will not see this for HR, Power and Pace!
3 Likes
Maybe you are right. It is all approximate.
After minute 7, my breathing pattern clearly changes. Before that, I do not notice any breathing movement. After that, it becomes noticeable. It still feels easy for me. I can talk. It is also clearly easier than my marathon pace. But subjectively, something changes.
In my comparison tests, my estimate of the first ventilatory breakpoint (VT1) on the bike and in running always turns out to be easier than the first lactate threshold (LT1). And I will add here that VT2 almost always matches LT2 when I compared the ventilation curves and the lactate curves.
Have you used the Core sensor at the same time as the Tymewear sensor? Any issues?
Yes, I use both Core and Tymewear in every workout at the same time. In general, there are no issues.
However, there is a difficulty when using Core together with “other sensors” on Garmin watches (I have Fenix 8).
Tymewear support recommended setting the value 32 in the ConnectIQ settings under Core Body app. This is also mentioned in the Core Body instructions.
After that, I have not noticed any issues.
Thus it seems that the Core sensor mechanically fits on the (somewhat different:-) tymewear strap.
Do you have a Core 1 or 2? Do you know if both fit?
Core 2 can be placed on virtually any HRM chest strap, the holes on the case are large enough. I use(d) it with Tymewear, Polar, Garmin HRMs without issues
2 Likes
That’s correct, I agree.
I have Core 2, and I have no issues with the mounting at all.
1 Like
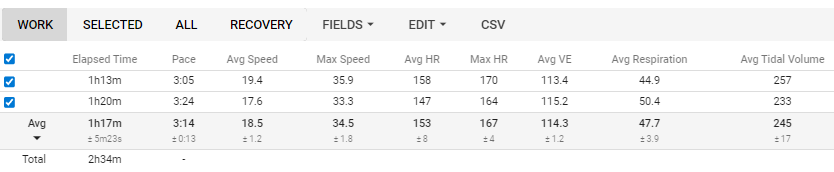
Yesterday I completed my first ski marathon using a ventilation sensor.
Sat, 24 Jan 2026
Distance: 46.35 km
Time: 2:30:45
Avg speed: 18.4 km/h
Climbing: 177 m
Air temperature: extremely low, −23°C
I got quite ambiguous data for heart rate and ventilation dynamics.
The chart is based on ventilation zones, with smoothed HR and speed (MA 180 s) overlaid.
-
The mass start was, as usual, very fast — you need to get out of the crowd and find a good group. Up to about 45 minutes, my average HR was ~160 bpm (this is my LT2 based on lactate tests). At the same time, ventilation stayed in VT1 until ~19 minutes (VE ~100), and only then moved into BP (VE ~118). Meanwhile, my speed was clearly above marathon pace, close to threshold — about 19.6 km/h.
-
After ~45 minutes, there was likely a data recording glitch — this is visible in both HR and ventilation traces. At the same time, I had already exited the pack and settled into my own position. My HR was around 155 bpm (tempo / zone 3), speed dropped slightly but was still high at about 19 km/h, while ventilation stayed at BP level (VE ~119).
-
After that, my HR kept steadily decreasing, as did my speed, but ventilation remained at BP. In the last 30 minutes of the race, my HR was only ~143 bpm (!!), speed dropped to 16.7 km/h, yet ventilation stayed in zone 2–BP (VE ≈ 111).
The race was split into two laps
I formulated two hypotheses:
- After the connection issue at ~45 minutes, the HR sensor started producing erroneous data.
- The reduction in speed (intensity) led to a lower HR, while the race effort remained at marathon intensity (RPE 6–7), so internal stress did not change, which was reflected by ventilation.
I checked the HR sensor error hypothesis by analyzing raw FIT-file HRV data and did not find clear errors. HRV data (RMSSD, SDNN) showed stable values before and after 45 minutes, with even a slight increase, consistent with rising load. Which, overall, confirms the stability of the heart-rate data over time. However, after 45 minutes I can still see some non-physiological HR spikes, which suggests suboptimal HR data quality.
That leaves hypothesis #2 as the working one:
lower speed > lower HR, while no cardiac drift occurred due to strong heat adaptation (89% according to Core Body data) combined with extreme cold (−23°C at the start, −19°C at the finish). At the same time, my perceived effort (RPE) and internal metabolic intensity remained stable, which was reflected in steady ventilation values — VE ≈ 114 (within the BP range of 110–130).
In any case, HR data quality remains questionable, but I was very impressed by the ventilation data, especially when compared to HR and speed.
4 Likes
Could anyone help me with this after my recent Sub Max Test.
A bit of context: My FTP is 190W-200W so I did this test just to 205W as doing full tests just wipes me out for a couple of days and tbh I’m only interested in my VT1 and Balance Point at the moment.
Something is obviously happening at 145W which is where I felt a change in breathing. Up until that point each step felt very similar to the previous one.If that was my VT1 it would be on the high side of believable if you know what I mean.
One thing I don’t understand is the relatively narrow range of VE. Could this be to do with my low VO2max of 40 ish ( I’m not concerned about that as I’m 70 yo)
My Garmin was obviously dropping the power signal for the last 2 steps but I dual recorded it on TrainerRoad and the power was in fact steady.
The test was preceded by an easy 30 min warmup
Thanks in advance
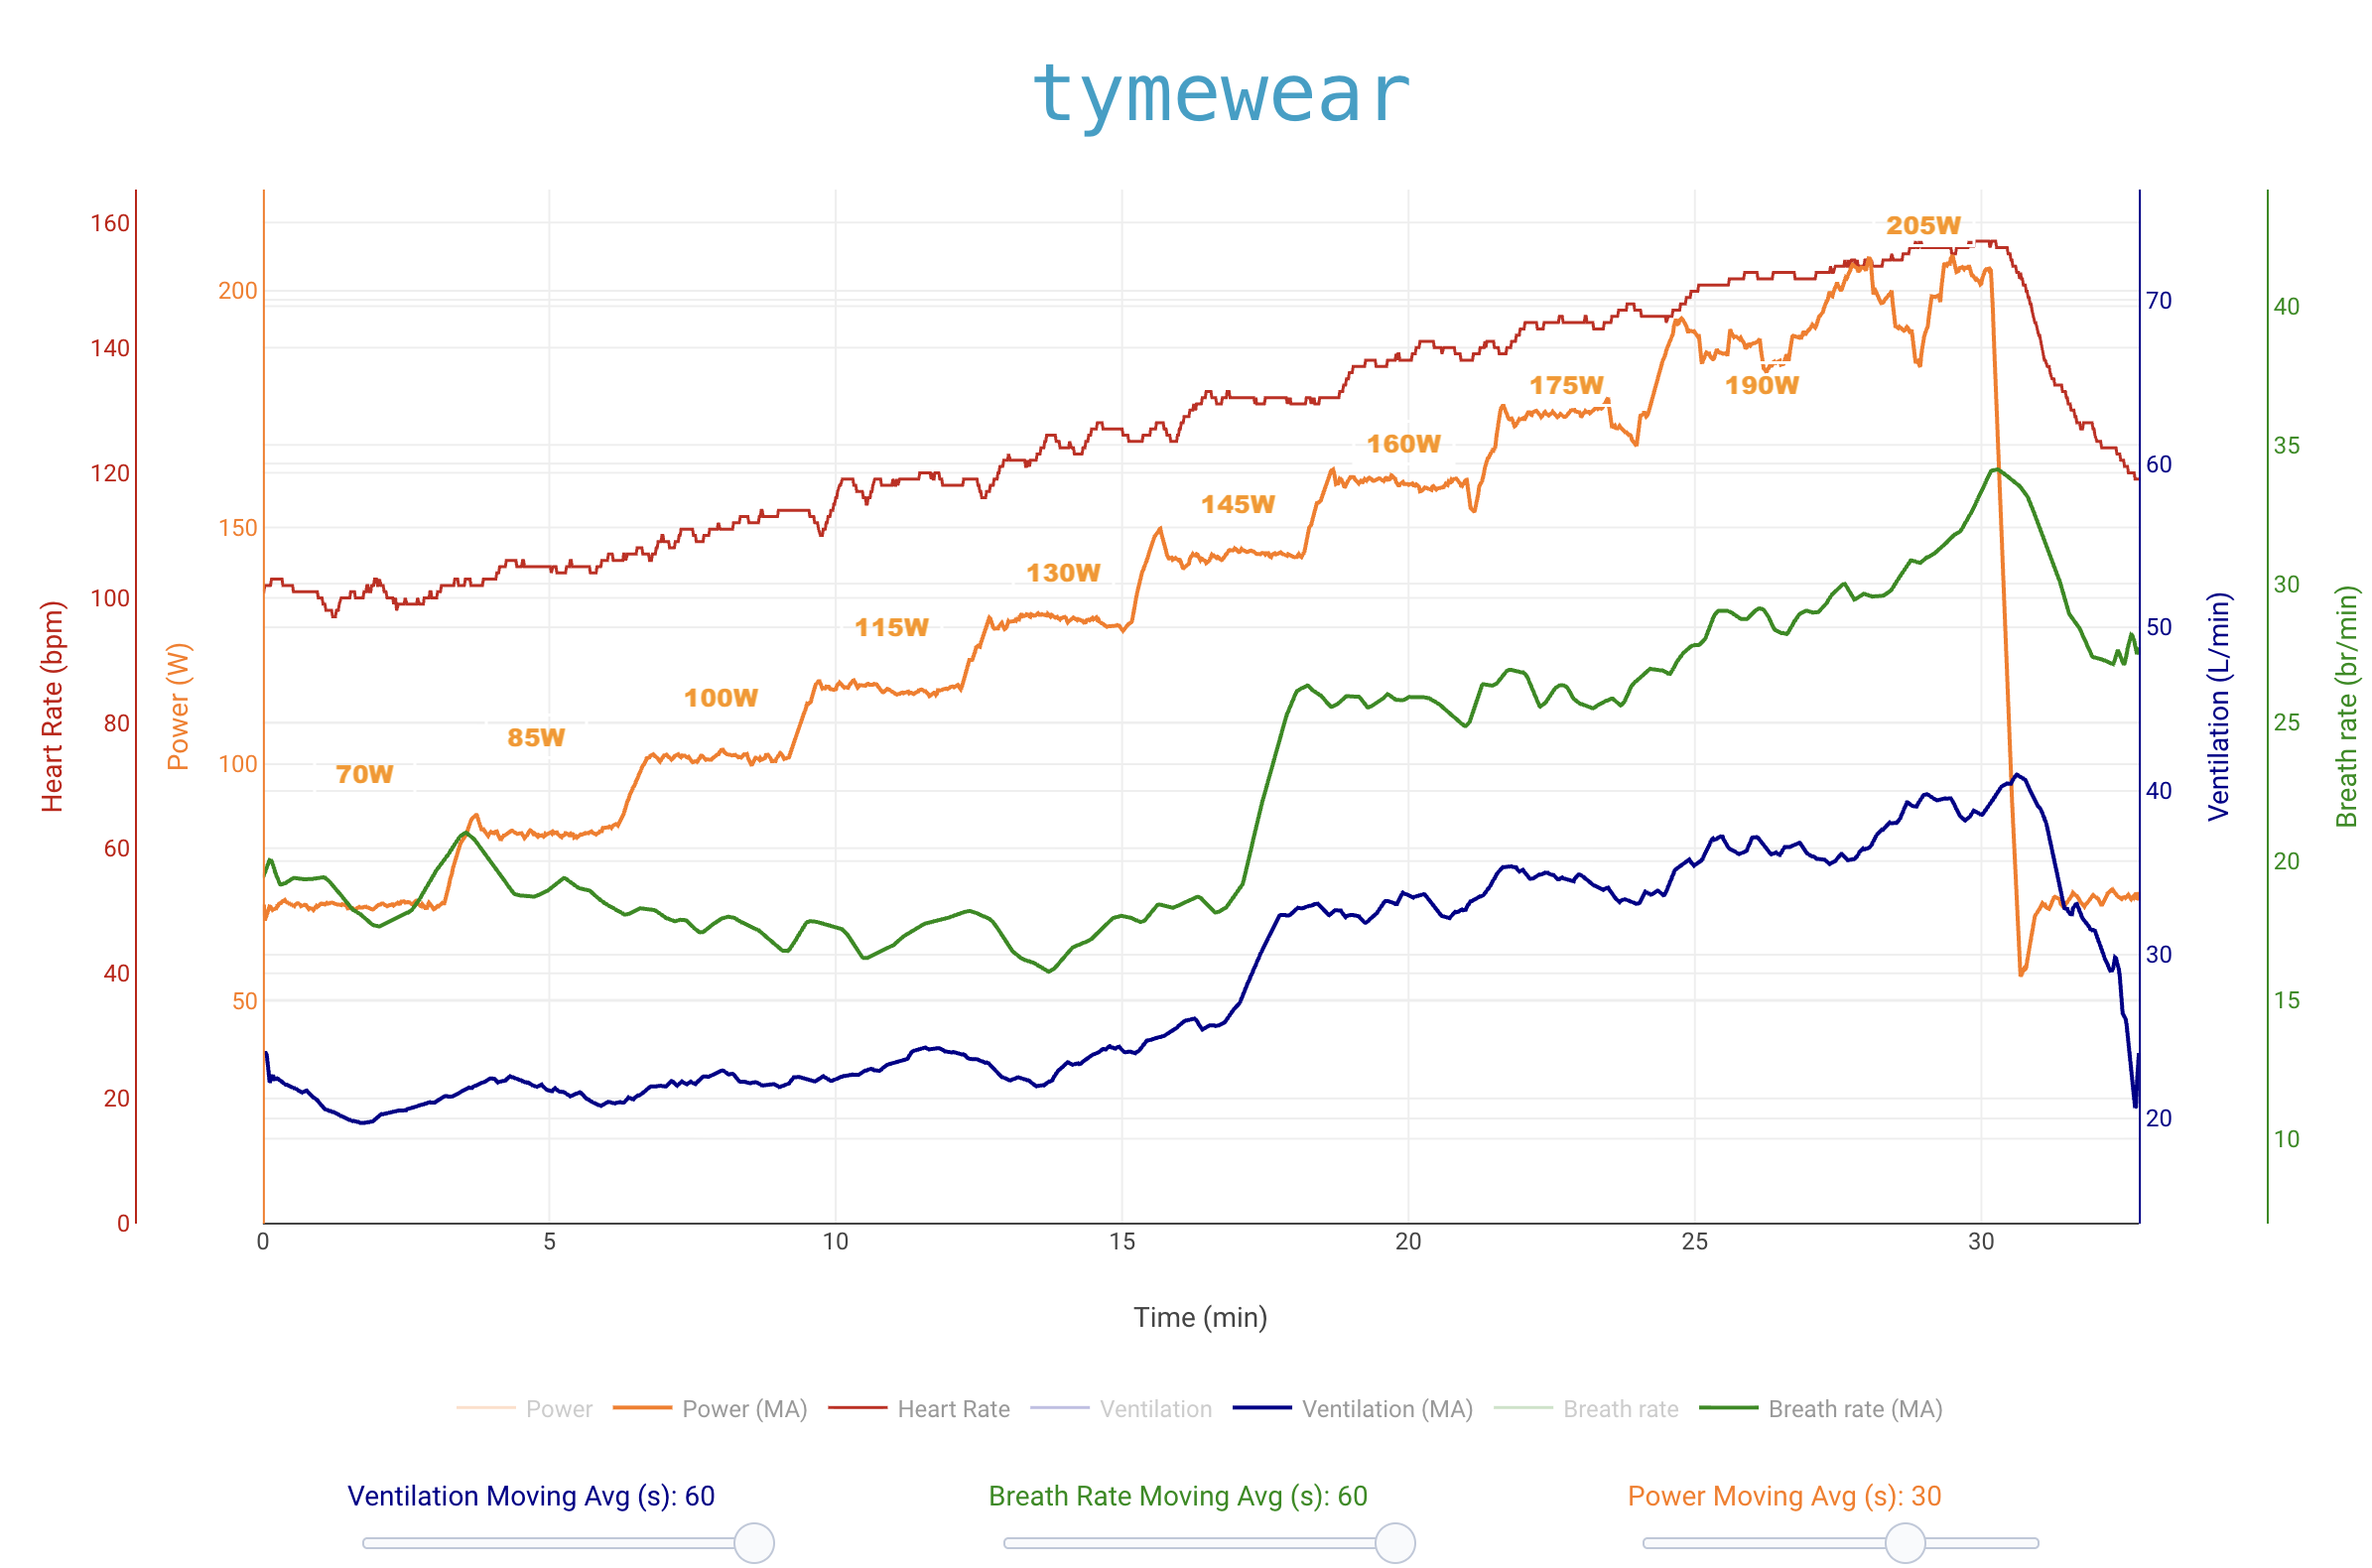
I would put VT1 at 130-135 watts, just before the change in respiratory rate. And give priority to Respiratory Rate changes over VE, regarding Tymeware metrics, with VT2 lower at 180-185 watts.
Thanks . Makes sense. Is FTP generally a little higher than VT2 then?
I’d probably agree with @miguell that VT1 is around 135 watts. That’s the upper end. Estimating BP is always difficult for me, since there aren’t any obvious criteria, but if you look at breathing rate, we see a change in pattern around minute 23–24 and power around 170–175 watts. Since the test wasn’t done to failure, there’s no way to estimate VT2, but based on my experience (comparing FTP from lactate testing and VT2), I’d note that my VT2 is practically equal to LT2/FTP.
As for the VE ranges, they’ll be individual for everyone, and what’s more, they differ significantly by sport — for example, VE in running will obviously be higher, and in skiing it can be even higher, even though metabolically these are the same threshold values
2 Likes
Thanks. Regarding VT2 - from an RPE perspective I felt I could have gone on for a quite a long time at 190W but definitely not at 205W as my breathing was starting to get a little ragged.
I’m curious if anyone has experimented with breathing rate to see the effect on the zones/thresholds estimated.
I’m fairly untrained w/r/t breathing, and looking at the chart from my threshold test a few weeks back, my BR was extremely variable, particularly in the earlier pre-VT2 stages of the test. My initial though was no problem, by body would adjust tidal volume and my VE would remain fairly stable, which is generally consistent with what I see.
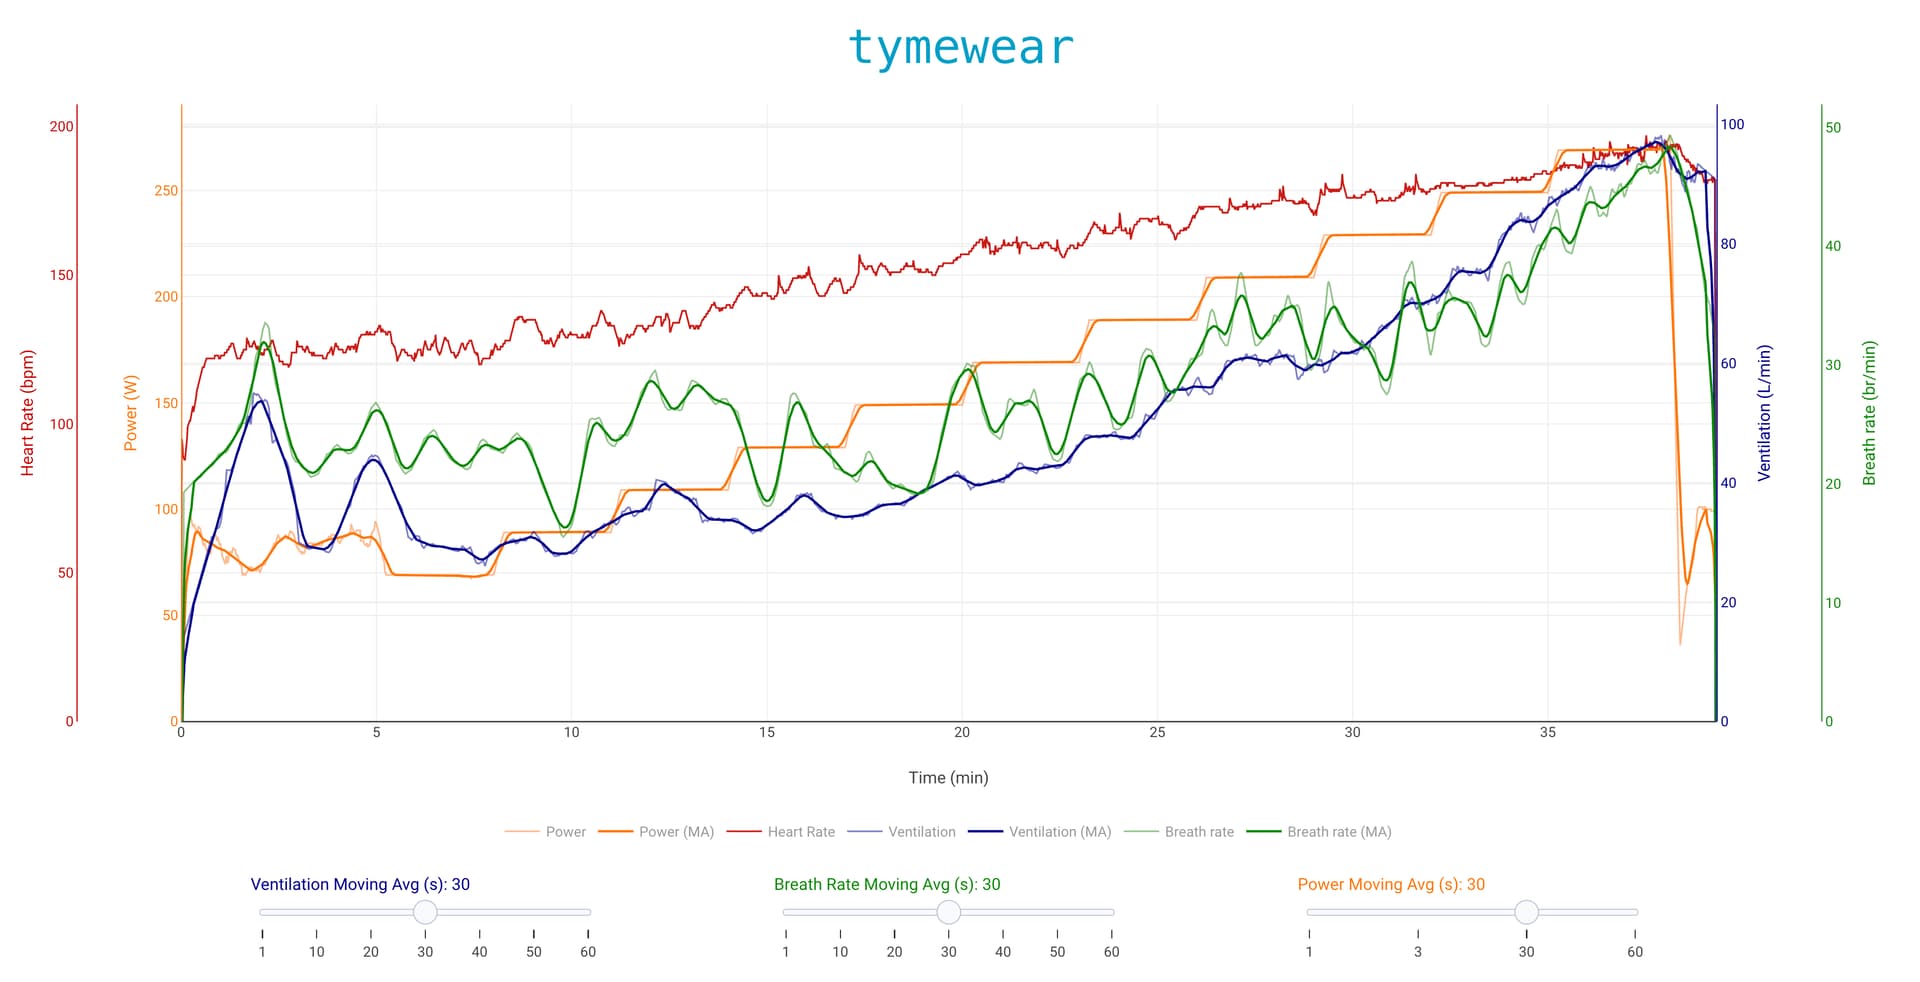
But then when I started doing training rides with the sensor out in the real world (I commute about 3 hours a day to work, mostly flat with a few small hills) I literally could not ride easy enough to stay in VT1/Zone 2. My VT1 threshold was estimated to 36, but literally on the easiest ride, power and HR WAAAY below where they should be, I would fluctuate between 35-48 VE. Even at rest waiting for long stoplights it would be at or around threshold.
Then I started intentionally taking longer, slower breaths, trying to really pull in from my diaphragm, even holding it for a second or two before and after each exhale/inhale. My VE would plummet down to 20-26 as my breathing rate dropped down to the teens. This all felt sustainable in zone 2, and my VE easily stayed way below VT1 threshold.
Times when I push towards zone 4/5 obviously I can’t control the breathing rate as much, and there is much less variation between BR and tidal volume when looking at the charts from my threshold test at the higher levels of exertion. It’s just at the lower level of exertion, I’m all over the place because I’m not really being intentional, and my breathing muscle memory probably isn’t really developed.
I guess I’m wondering if my irregular/untrained breathing during my threshold test might have biased the zones… Should I keep trying to teach myself to really control my breathing rate and/or diaphragmatic tidal volume? Do you folks keep a pretty consistent BR/tidal volume at lower intensities?