I’ve already shared some feedback on one of the forums about using the Tymewear sensor. I’ll post it here as well, and I’d really like to get some pushback or discussion around my observations and conclusions.
Just to be clear upfront: I’m not a professional athlete and I’m not a cyclist. My main sport is cross-country skiing. That said, I enjoy cycling and use it as part of my off-season training.
I’m 50 years old, I work full time, and I have two kids. Over the last 12 months my average training volume has been about 7.5 hours per week. My PBs are a 1:29 half marathon and a 2:21 ski marathon.
I consider lactate and RPE to be the most practical and valid markers for assessing internal load. In every training session, I monitor and calibrate the stress load using lactate values, both in hard and easy workouts. I define anchor threshold values for power and heart rate based on lactate results. Regular tests also allow me to track power progression over time, roughly once every 3–4 months.
At the same time, since I started using Tymewear, I use ventilatory thresholds for online monitoring of metabolic internal stress during training. In this approach, power/pace and heart rate are secondary and used mainly as reference.
Below is a comparison of lactate thresholds and ventilation.
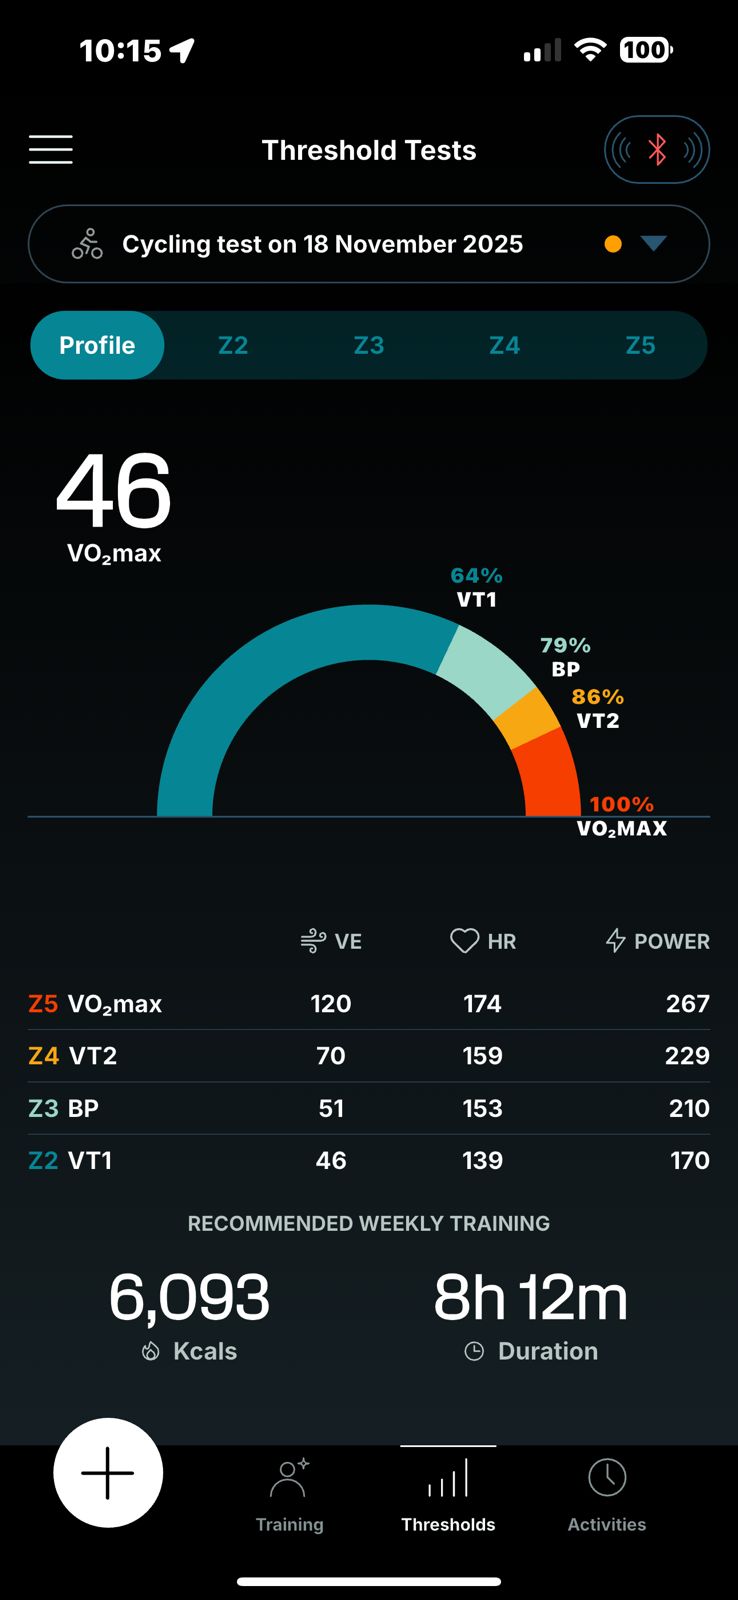
First Tymewear test — 18/11
Lactate
• LT1: Power 185 W, HR 145
• LT2: Power 225 W, HR 158
• Max Power: 270 W
• Estimated VO2: 44.4 ml/kg
Tymewear
• VT1: VE 46, Power 170 W, HR 139
• VT2: VE 70, Power 229 W, HR 159
• VE VO2: 120, Power 267 W
• Estimated VO2: 46 ml/kg
Tymewear recommended focusing on VO2 and Z2 improvement, which I tried to follow during the next month.
Zone 2 calculated from Tymewear ventilation and power data (VE 46 / Power 170 W) was slightly lower than Zone 2 derived from lactate data (185w). This was confirmed in subsequent training sessions.
- During the month, my easy sessions at VT1 ventilation level (VE 46) resulted in average power well below LT1, around 130–150 W, with lactate about 1.1–1.3 mmol. This is significantly lower than my LT1 power (~185 W).
- My hard VO2 workouts at around 270 W showed ventilation values between 75 and 116 (average ~95), with lactate above 7 mmol, clearly in the VO2max domain. At the same time, average heart rate during intervals was around 160 bpm, which should correspond to LT2/VT2. In this case, lactate and ventilation confirmed the internal load, while heart rate did not increase further. From this, I conclude there was likely some suppression of the nervous system.
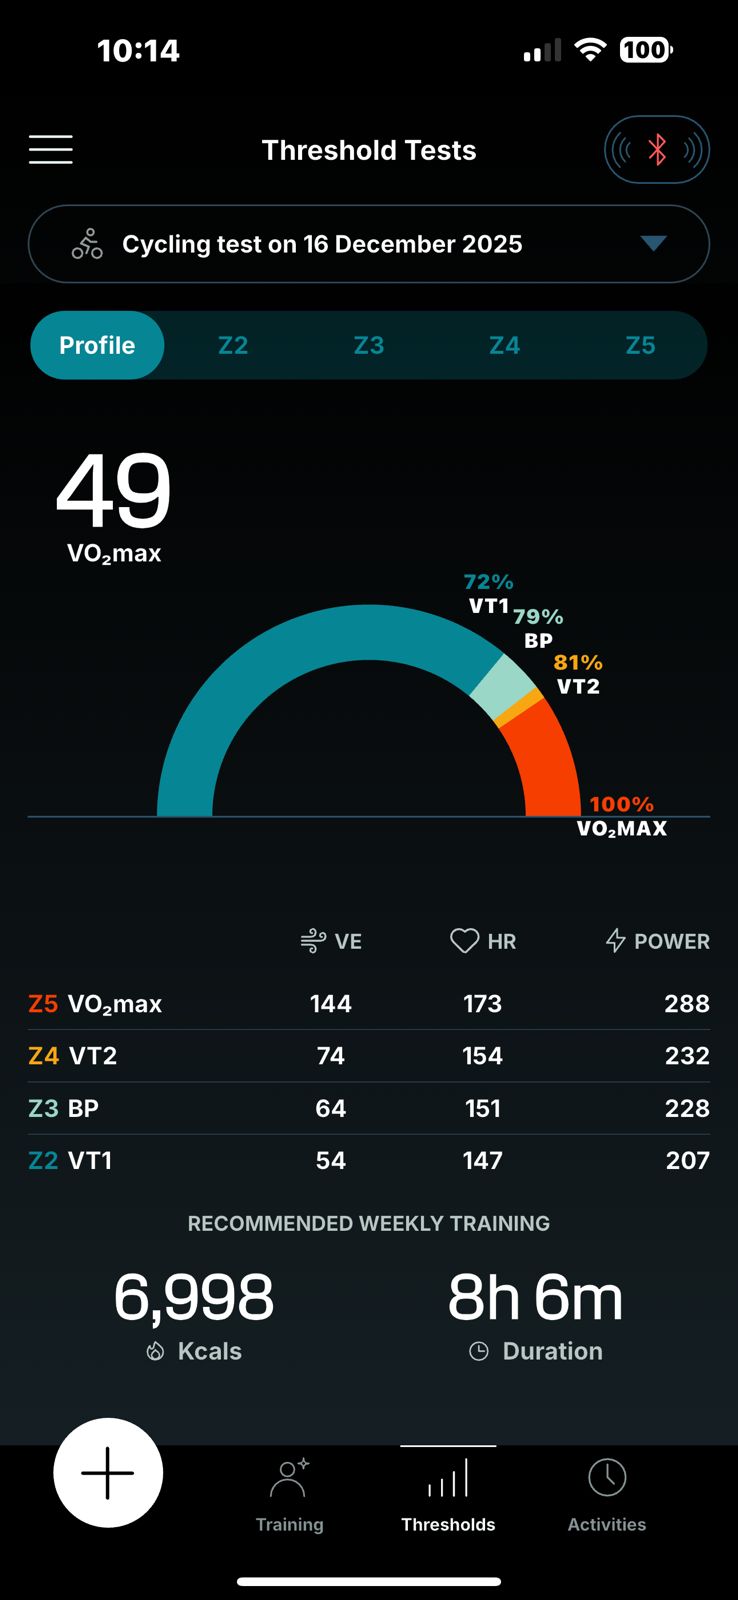
Second Tymewear test — 16/12
after:
Total training time: 37.5 hours (~7.5 hours per week), including:
• Cycling: 15 hours
• Running: 7 hours
• Skiing: 9 hours
• Other (swimming, strength): 6.5 hours
Cycling volume: 15 hours
10 sessions total:
• 4 HIIT sessions, RPE 8–9 (VO2)
• 11 easy sessions, RPE 1–3
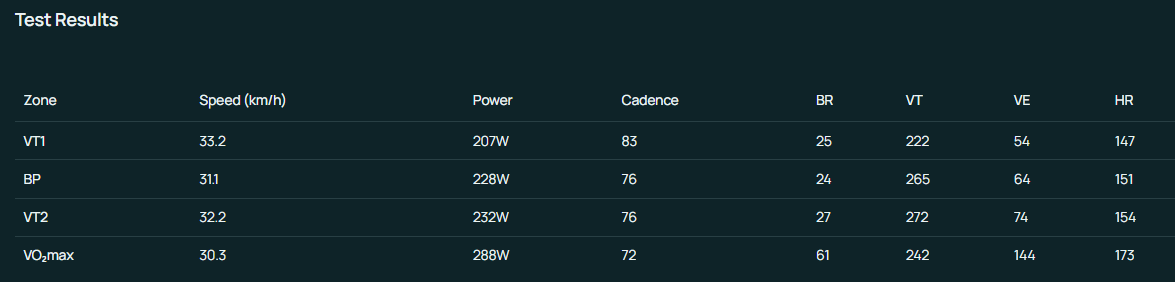
Test results
Lactate
• LT1: Power 186 W (+1 W), HR 141
• LT2: Power 235 W (+10 W), HR 159
• Max Power: 290 W (+20 W)
• Estimated VO2: 47 ml/kg (+1)
Tymewear
• VT1: VE 54 (+8), Power 207 W (+37 W), HR 147
• VT2: VE 74 (+4), Power 232 W (+3 W), HR 159
• VE VO2: 144 (+24), Power 288 W (+21 W)
• Estimated VO2: 49 ml/kg (+3)
Tymewear recommendation: focus on VO2 and Z4 improvement.
In this test, as in the first one, I observe very similar threshold values at LT2/VT2 and VO2. However, the power values seem overestimated to me. At the same time, VE 54 is likely very close to LT1 power, around ~180 W or slightly lower. Based on only two tests, I would conclude that Tymewear’s threshold values and VO2 estimation are very close to laboratory measurements, while VE/Power at low intensity (first threshold) may vary somewhat.
My conclusions
Tymewear estimates of power and heart rate can differ significantly. Power and heart rate thresholds represent the upper limits of training zones and are more of a reference than a true anchor for training planning. Ventilation, in my view, reflects internal load quite accurately. My intensities at FTP (LT2) and VO2 levels clearly fell into the corresponding ventilation zones, while my easy sessions stayed below LT1, which I see as positive and on the safe side.
In my training, I use three criteria:
- Lactate-based LT1/LT2 as anchors for power and heart rate thresholds and for progress assessment
- Online VE as a red line for internal stress during training
- RPE plus control of cardiac drift
It is important to understand that no test is ever 100% accurate, even in a laboratory with gas analysis and lactate measurements. These are just tests. Thresholds and values are not fixed forever. I have had sessions where training felt very hard, but lactate consistently showed intensity well below the first threshold (likely due to low glycogen). I have also had sessions where I could not maintain heart rate in the target zone, while lactate was clearly above my threshold values (central nervous system fatigue). At the same time, I have had workouts where, to maintain the same ventilation intensity, I had to reduce power by about 20% from the beginning to the end of the session.
And a few subjective observations from this month. I improved my maximal power, which was confirmed by testing. Easy sessions with ventilation control became even easier, and my general feeling is that I get tired, but I can repeat the same training the next day without difficulty. My VO2max workouts were very hard, extremely hard. However, I could see that ventilation during the intervals was clearly in the VO2max zone, while heart rate did not reach the commonly cited 95% of maximum. I honestly cannot imagine how hard I would have had to push to reach 95% of my maximum heart rate.
I will continue to explore this further. For now, the ability to monitor internal stress online looks very promising to me.