Thanks. I just re-analyzed them.

Trying to integrate the Tymewear data, and I see the respiration and ventilation charts below the main data chart, but it’s not integrated. I realize that I’m likely missing something very easy, but can’t find it. Appreciate what everyone has done integrating this information.
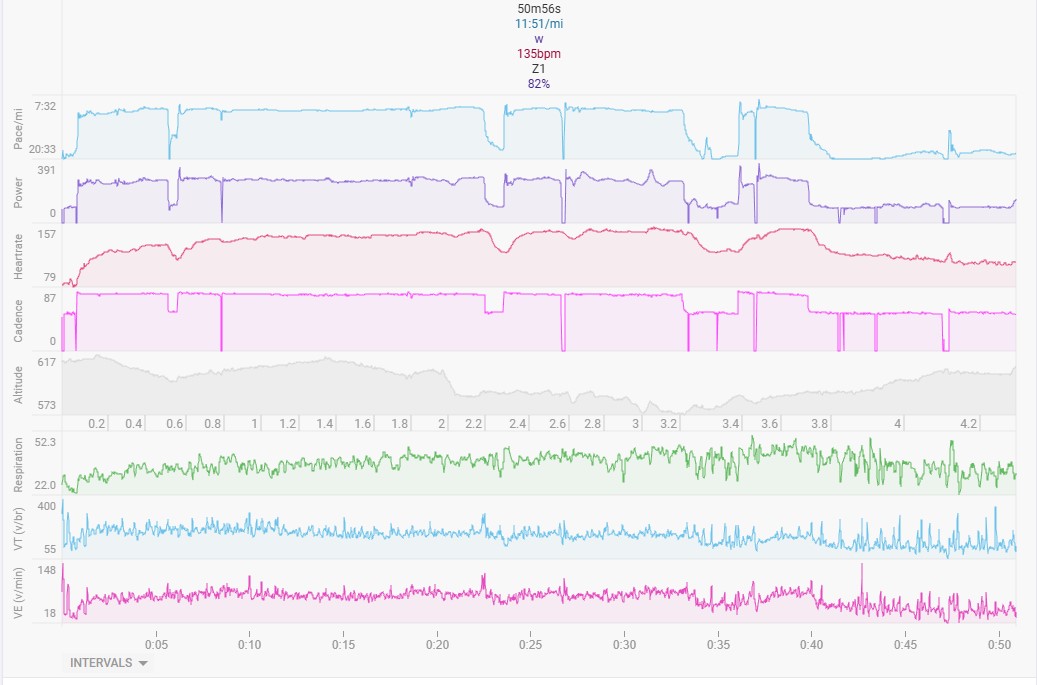
Go to the Activity’s bottom menu
CHART–>CUSTOM STREAMS
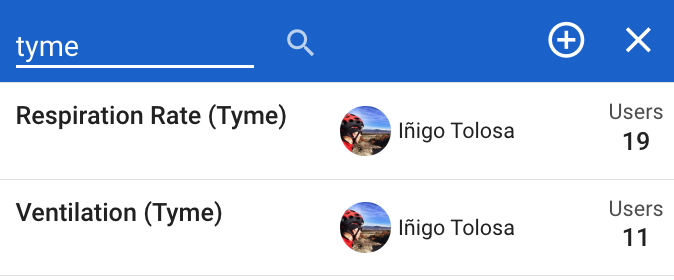
Select these streams
Then reprocess the activies containing Tymewear data that were uploaded to intervals before.
1 Like
Thank you!
I noticed that if you record an activity only using tymewear app and export the fit file it writes power as tyme_power instead of just power so intervals.icu is not picking up the power data from the fit file. Can this be added as a source to look for power data? Thanks
I have added tyme_power. Will deploy Thurs AM.
1 Like
Thanks!
I have a question: Is there a short How-To to integrate the TymeWear data-streams into the graph? I am relatively new to Intervals and am at a total loss.
1 Like
1 Like
Worked like a charm! Thanks, @Inigo_Tolosa !!
1 Like
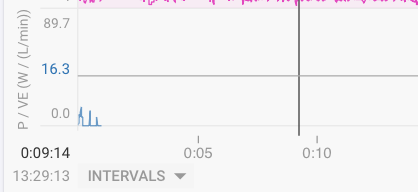
I am trying to create a custom chart/stream to display the ratio of power to ventilation. With partial success… :-o
{
  for (let m of icu.fit.record) {
    data.setAt(m.timestamp.value, (m.power?.value / m.tyme_minute_volume?.value))
  }
}
This works on some activities
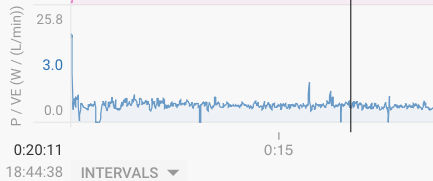
behaves funny on others (values are there, but graph is missing:-o)
and not at all for others…
I did “reprocess original file” for all of these activities.
The script is public as “P / VE (W / (L/min))”. Is there something obviously wrong with this script?
Any other clues?
You could insert some console.log() statements to debug your activities where it doesn’t work.
Additionally I would avoid the possible division by zero cases, and set it to a fixed value (zero) in that case.
1 Like
Thanks!
It was in fact “weird” (undefined) power values, i.e., the nominator that were causing issues. I only compute it now when both power and ventilation are >0, this seems to work and is all that’s needed here I believe…
Related question on fields, not streams… There is a “Avg VE” field

How do I find out what is its name in javascript, i.e., something like interval.average_VE?
I’m often too lazy to look it up, so I use this code which shows every field inside the activity json and then search the console for the value:
{
sl=icu.activity;
for (const property in sl) {
  console.log(`${property}: ${sl[property]}`);
}
}
1 Like
Try
For custom streams

{

    let ve = icu.streams.tidal_volume_min;
    let power = icu.streams.watts;


    for (let i = 0; i < data.length; i++) {
        data[i] = (ve[i] >0)? power[i] / ve[i] : 0;
    }
}

for interval field

{
  let power = icu.streams.watts;
  let ve = icu.streams.tidal_volume_min;
  let totalPower = 0;
  let totalVE = 0;
  let validPoints = 0;

  for (let i = interval.start_index; i < interval.end_index; i++) {
    // Only check that power is defined and VE is positive
    if (ve[i] > 0 && power[i] !== undefined) {
      totalPower += power[i];
      totalVE += ve[i];
      validPoints++;
    }
  }

  validPoints > 0 && totalVE > 0 ? totalPower / totalVE : 0;
}
2 Likes
@R2Tom and @pepe , thank you for your help!
And while this looks like real code that becomes handy for more (I am just building on my old C and C++ skills to “fudge” javascript😉),
… it leaves you wonder why David picked these funny inconsistent names that mix gauges (really, quantities) and units – or contain units to begin with😉 Still, i.icu is wonderful:-)
Alternatively for interval fields
{
  interval.average_tidal_volume_min > 0 ?
    interval.average_watts / interval.average_tidal_volume_min :
    undefined
}
Benefits of this approach:
Uses built-in averages - intervals.icu already calculates proper time-weighted averages
No manual loops - much simpler and more readable
Better performance - no JavaScript iteration overhead
Automatic data validation - the platform handles missing/invalid data points
Consistent with other metrics - follows the same pattern as other interval properties
Source. Github Intervals.icu js-data-model
Thanks!
Yes, this is where I started:wink: And the GitHub-link hint is what I was looking for, “where/how to find the variable names”![]()
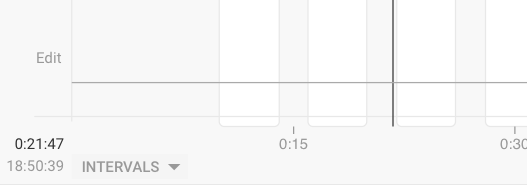
where can I find this chart?