I’ve been using TRIMP - for well over a year, with heart rate and power data ( I only cycle) - Today I was looking at my setting and changed it to HRSS and my previous 2 months or so all dived down into the red - high risk zone. I consistently train about 10-15 hours a week - 85/15-ish (Z1/2 and Z4/5).
I was kind of stunned to see that. Switching back to TRIMP and I go back to dipping into the red occasionally.
Am I doing something wrong in the setting? I get data daily from my rides and update my wellness daily.
I think it’s possible your FTP is not up to date. Load based on Power uses ftp in the formula. A higher FTP will lower the Load.
In my personal experience I will have a higher Load # using power if I don’t get my heart rate up during intervals. I get a higher Load # using TRIMP if I am on a long ride and I don’t let my heart rate come down because of repeated, short high bursts of watts or general decoupling.
For the purist, (not said in a negative way,) using both concurrently is problematic. If you have some exercises that can’t have watts that’s something to keep in mind. When I had to use both I didn’t see numbers that altered my training but I’m not flying the edge of the envelope either.
And of course there’s the qualifier. These charts are only estimates. Each individual’s physiology reacts differently. It’s critical that we are monitoring and honestly evaluating our bodies response to the stress. There are no bragging rights. All continued time in the red likely means is that someone isn’t taking the rest periods needed for the healing adaptations to take place. Our muscles and supporting systems adapt and become stronger with rest.
If you have power data, surely that should be prioritised over HR data?
I don’t have power meter on all my bikes, so if i go for a gravel ride, intervals would see there’s no power data and look at TRIMP (which I have set up as second priority)
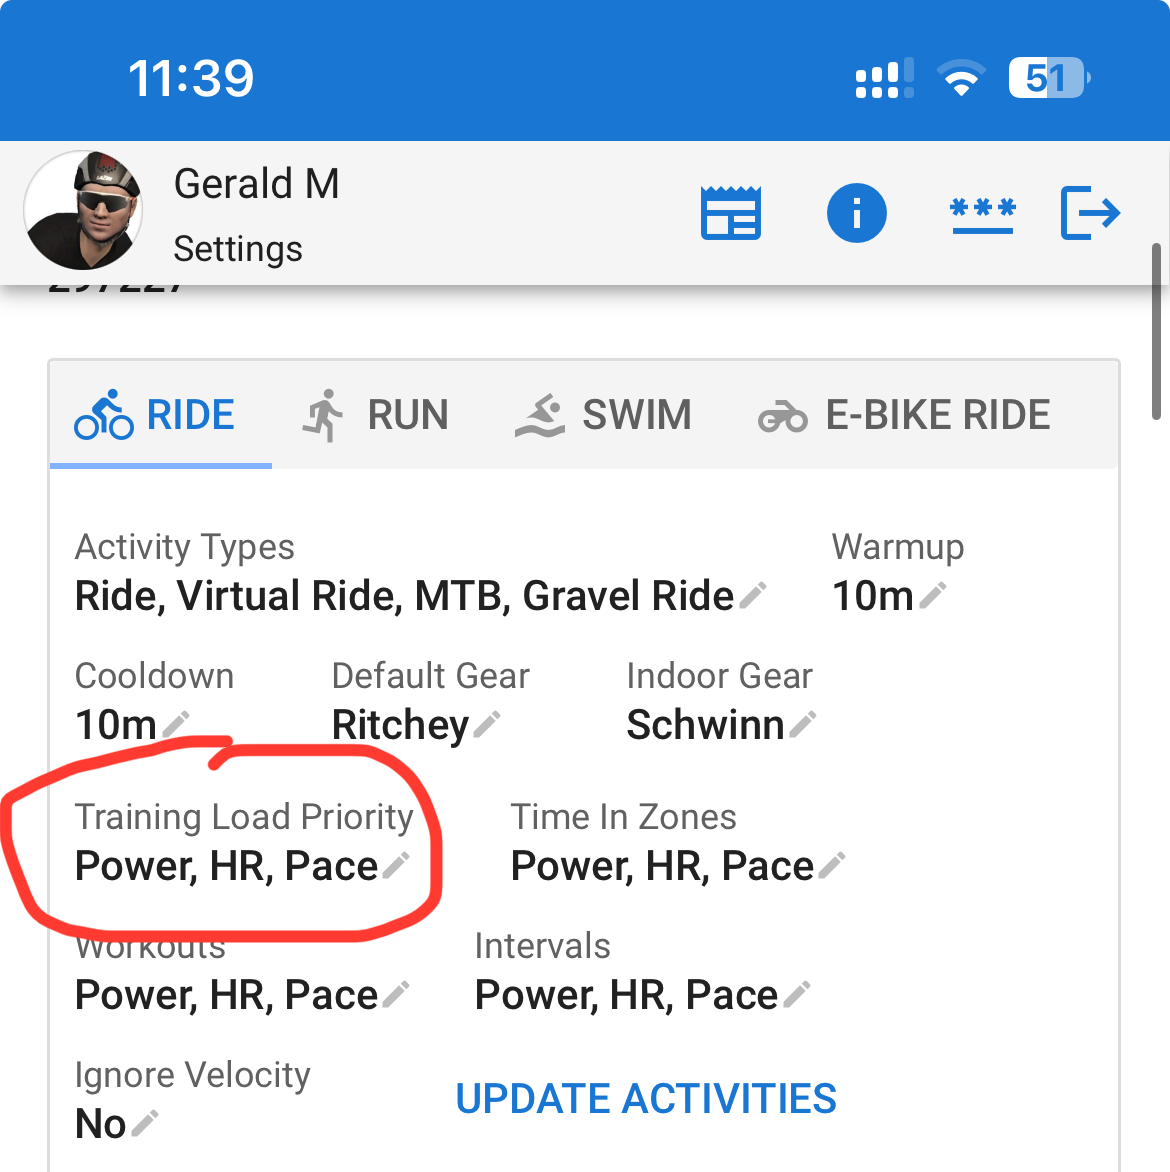
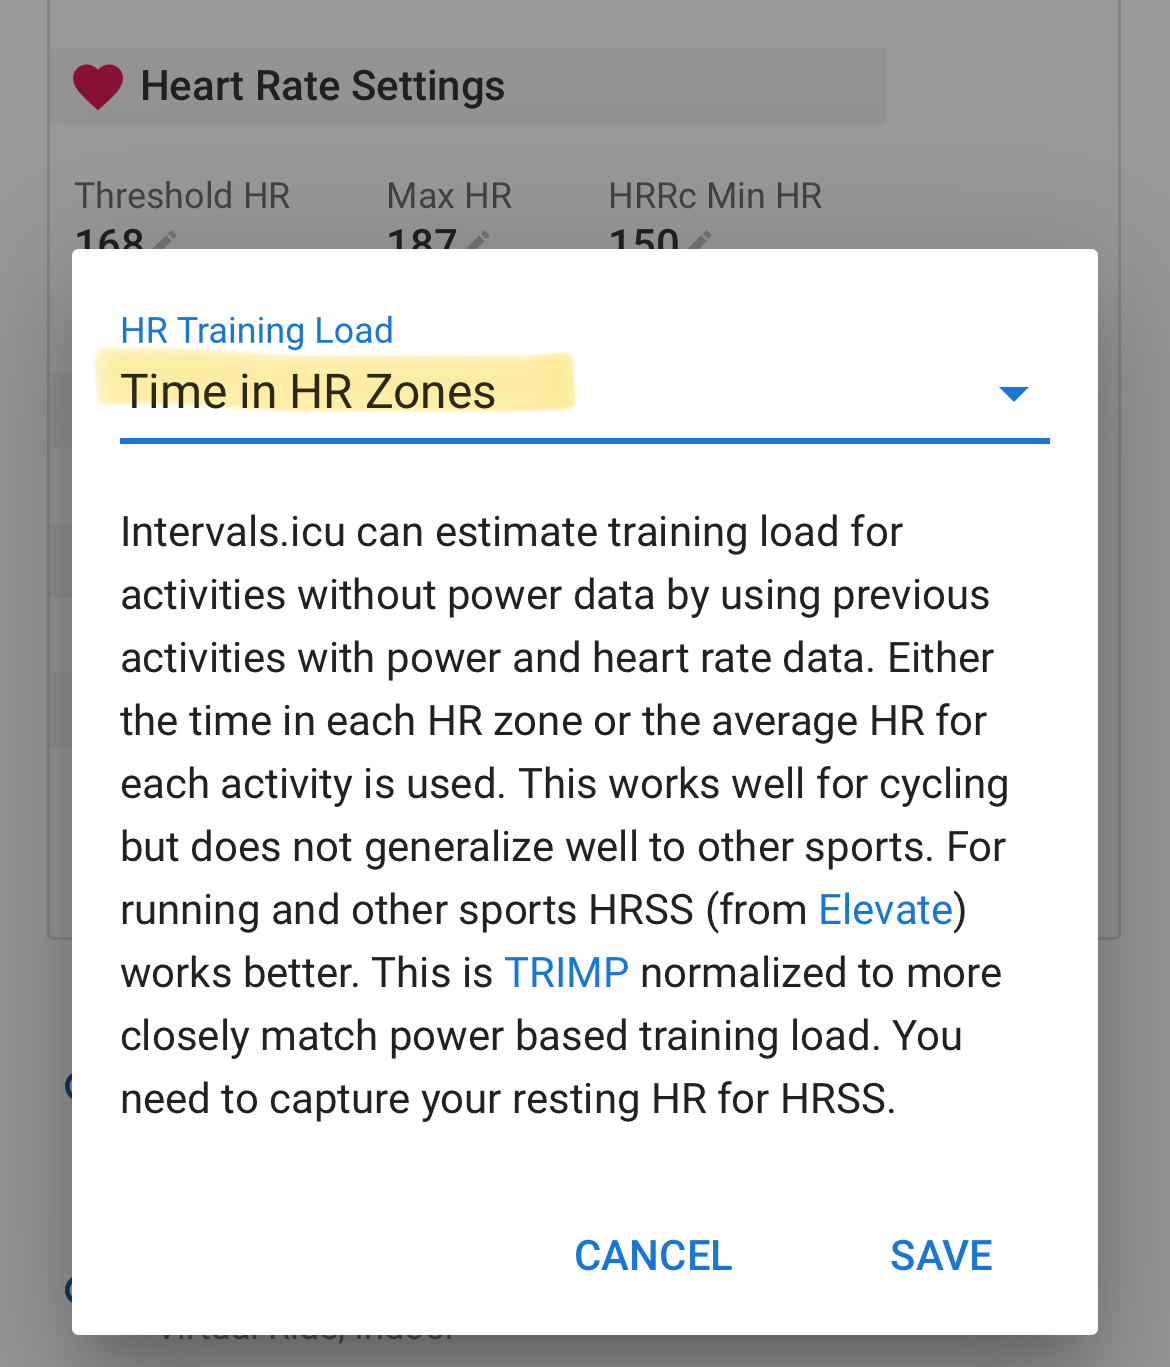
That’s correct, assuming you have selected Time in Zone as the setting for HR, and also have the training load priority as Power, HR, Pace, as you mention.
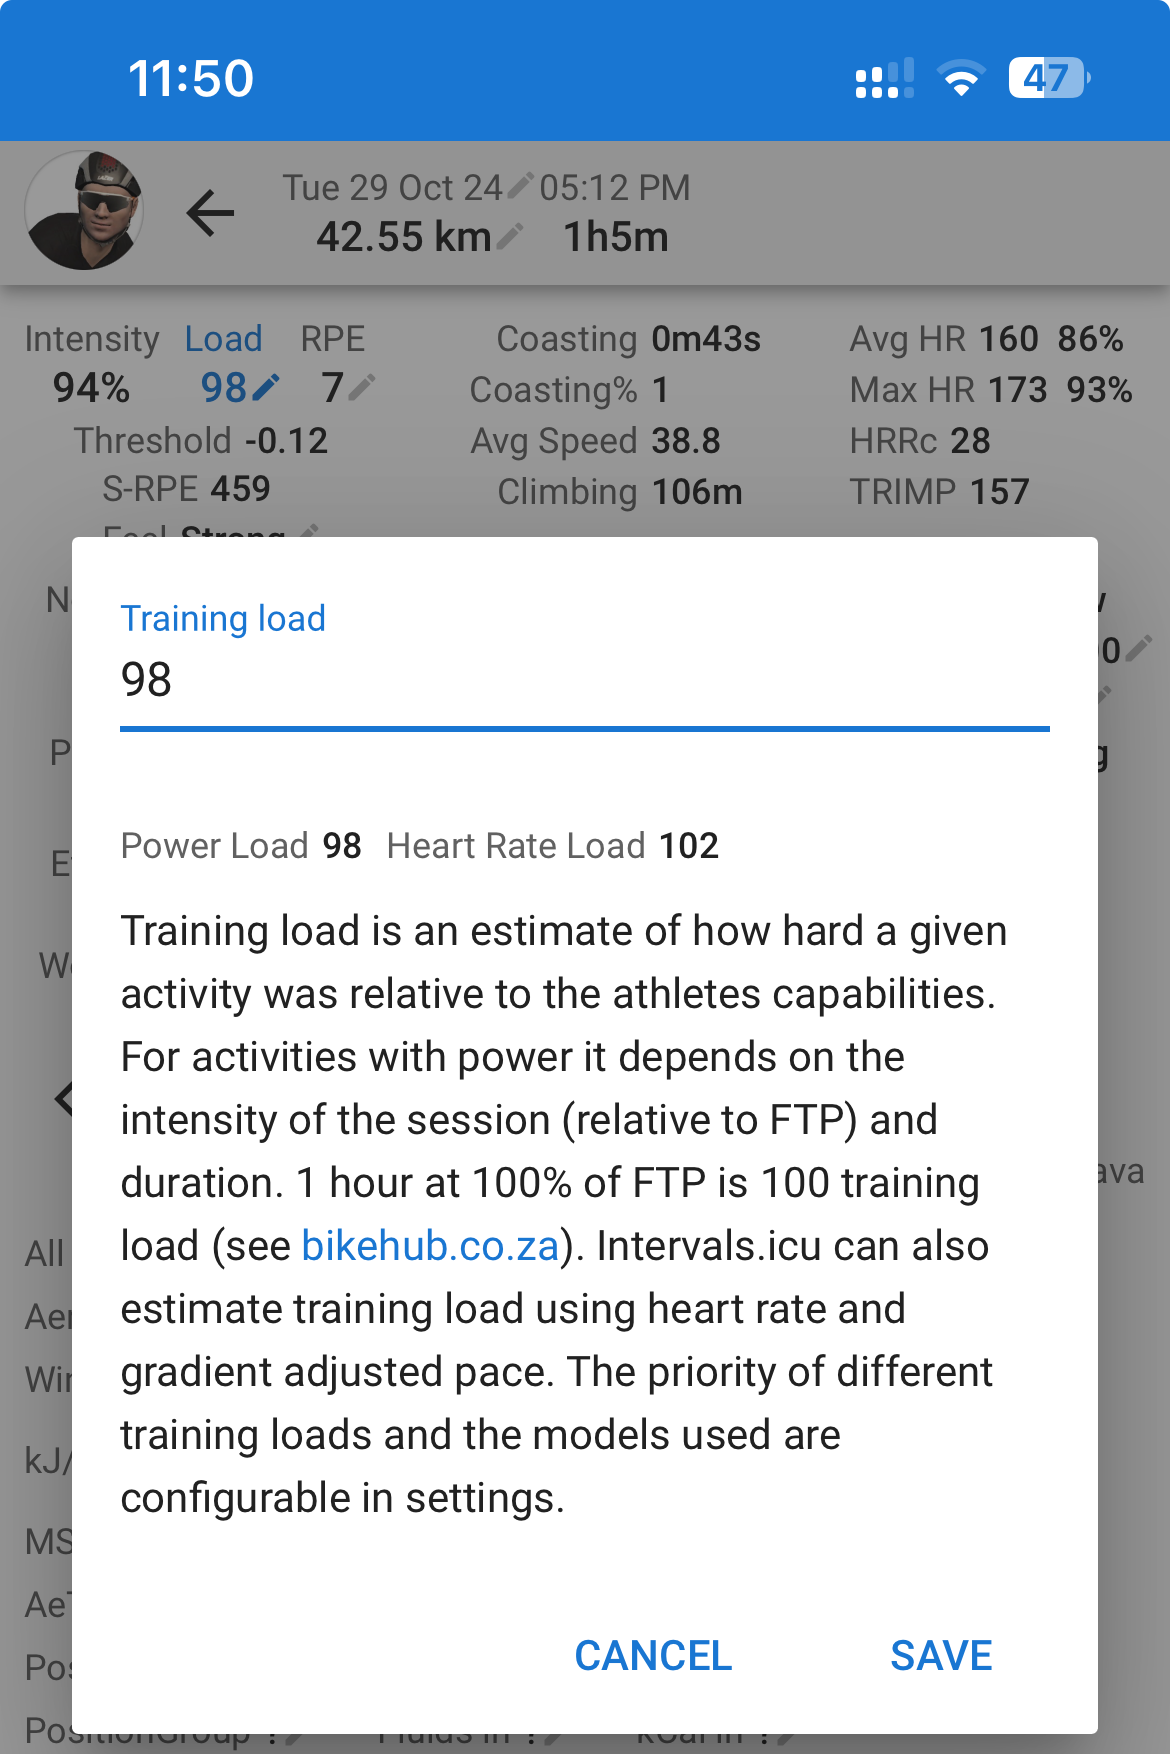
I’d imagine there could be sections where power is zero, due to freewheeling, and HR might still be high after a harder effort. So I took an effort (below) where I would be pedalling for the full duration, at steady state, but still working relatively hard… 98 (power) vs 102 (HR).
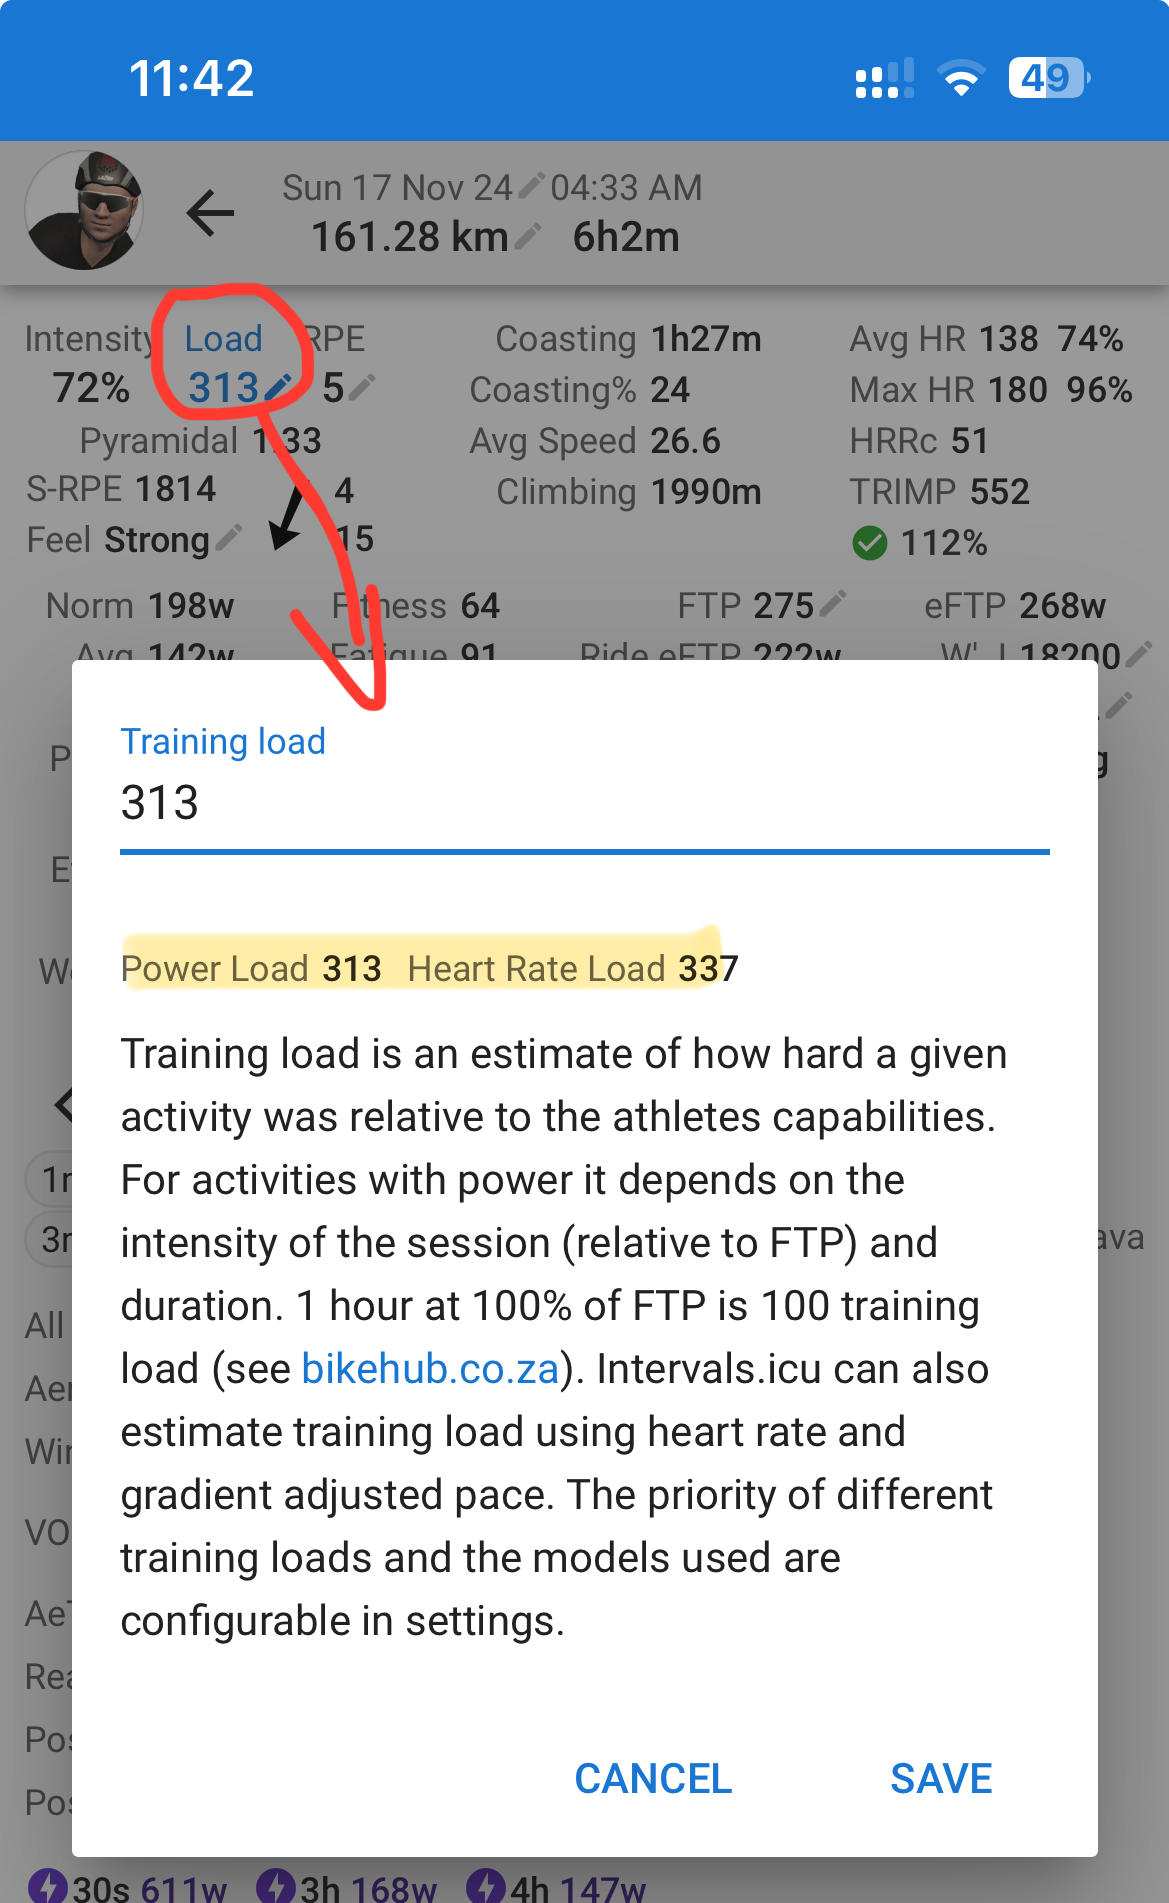
That’s my experience too. Above settings will result in Power and HR load being really close. The small differences shouldn’t influence the Fitness chart much.
I see now I’m using HRSS normalised TRIMP. My TSS estimates also appear to be slightly higher than power based ones for most activities. But it is not always.
I’m set up as you show, except I have HRSS selected instead of HR Zones.
I see significant decoupling between Running (Stryd) Power Load and HR Load (HR load low) on lower HR efforts, but not on higher HR efforts. Do you know if this is to be expected, it maybe an indication that my rFTP is too low / LTHR is too high? It’s been quite a while since I’ve fed the models good running race data.
If the model has not enough data from runs with Stryd Power and HR, the results will be less good.
Did you use another Running Power source before? Garmin wrist power for example?
In that case the model still has the relationship from that period.