I’ll share the Google Sheets link with you later today.
Sweet. Share me any information alongside it and I’ll see what I can do to help get it working.
It would be perfect if you can make it work in Google sheets. I’ve made some attempts getting it to work in LibreOffice Calc on my Linux desktop but got stuck really fast. The challenges are
- Connecting to the intervals API with basic authentication (user: “API_KEY” with password “personal API key”)
- The data comes in as EN-US formatted, comma separated values. That’s fine if your regional settings are EN-US but in Europe, that’s immediately a mess because we use comma as a decimal separator. I used to Find/Replace the comma delimiter by a semi-colon as a first step. In Europe, csv’s are usualy delimited with a semi-colon for that reason. In Excel it is handled pretty easily with the Power Query Editor. Don’t know how Google sheets handle that.
- The calcualtions and formula’s are pretty straightforward. There should not be much work for that
- The graph building is plenty of workarounds to overcome Excel limitations. The most difficult in my opinion is building a background with zones that are colored differently. For Excel I found a tutorial, thanks to the example Gerald gave me: Shaded Quadrant Background for Excel XY Scatter Chart - Peltier Tech
Wishing you the best of luck and don’t hesitate to ask questions for a better understanding of the logic and functionality of the chart.
The API works, thanks to another Intervals’ user. I’ll find his name and give credit, as there is a Next Activity suggestion in the file. I have been able to add to it, just like the current Excel file works.
I’m a Mac user as well and found similar issues, could you send me the Google sheets link as well please?
The link to the Google Sheets version is:
@William_Barnes created, or shared, a Next Activity file with the script for getting the Activity data through the API (thanks William). Note that this file will not work in Excel, due to the script. I’ve add the link to get the Wellness data, and then added the ATP and iThlete HRV information.
Make a copy for yourself, then type these into the red blocks on the Daily Record tab your [athlete ID] and the [API key] which can be found in the settings page. Then click on the Import data button and wait for the data to populate in the Activities and Wellness tabs. If anything needs to be updated, let me know, and I’ll make the necessary changes.
The graphs are missing, as Google Sheets doesn’t have the same BI capabilities as Excel, but this doesn’t mean that it can’t be done. If you are able to get working graphs, please go ahead. When I get a chance, I’ll see if I can work on an alternative plan.
Another macOS user as well. I avoid Google like the plague. Numbers and Pages are my chosen office apps. I have a copy of ‘Excel for mac’ for special needs like this.
@Gerald @MedTechCD
What’s the URL to the latest version of the Excel version? Is the link in the opening thread message always to the current version?
The link is available further up this thread:
It doesn’t work on Excel 365 on my wife’s MacBook, as some others have indicated, nor on the Online Office edition. She doesn’t use Numbers or Pages.
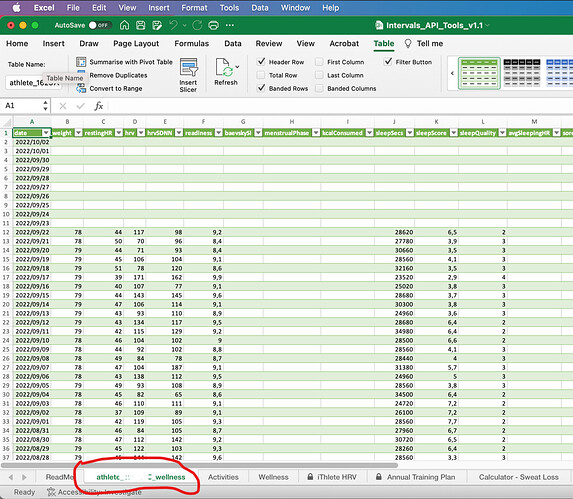
The only other option, for Mac OS users, is to download the Wellness and Activities data from Intervals, then copy and paste into the relevant tabs. It’s inconvenient, but it allows updating of the charts.
That’s a good suggestion that I didn’t know would work.
Will try… TQ…
I don’t have Excel 365. I have Excel for Mac v16.16.27. (I try and avoid Ms and subscription based software. Thus, my old copy of Excel works for the most part as a backup app.) I guess I just need to give it a whirl, follow the ReadMe, and post what errors I get. Else, copy & paste. @app4g, if you find a smoother way of integration please let us know! Tnx.
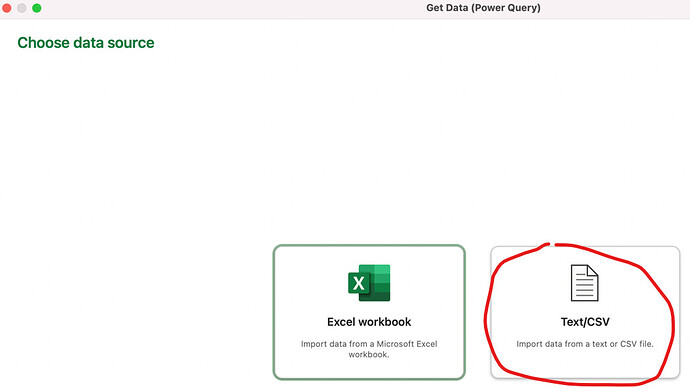
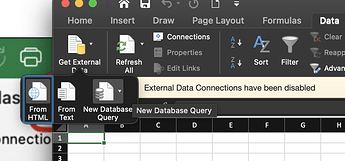
Check in your version of Excel, in the Data tab if you have the option Get Data.
You would need to see if you can edit permissions to be able to use the API.
Knowing Apple’s view on data protection, it might not be possible
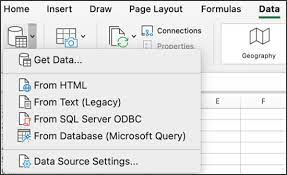
The other option, would be to have a download file that you copy the manual download to, and then use the Get Data, from a CSV file option. I do that currently at work, for my Colleagues that are a little less PC literate than me. I setup dashboards for them, and they can simply download the report data.
I’ll share some screenshots once I’ve set that up.
That is another possibility. Manual download from Intervals and change the data sources to the locally downloaded files. If Excel for Mac permits that, you could then try to find another utility that polls the Intervals API daily and downloads in the background.
It is possible to setup using a manual download, but will require a separate Excel file to do this.
I’ll set it up on my Windows laptop and test on the Mac.
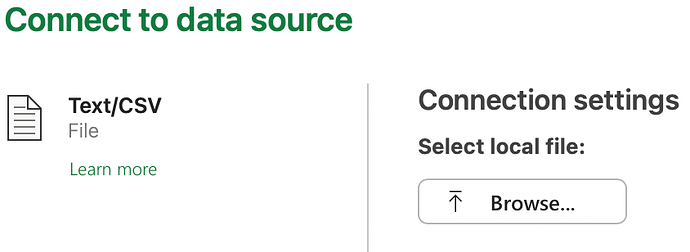
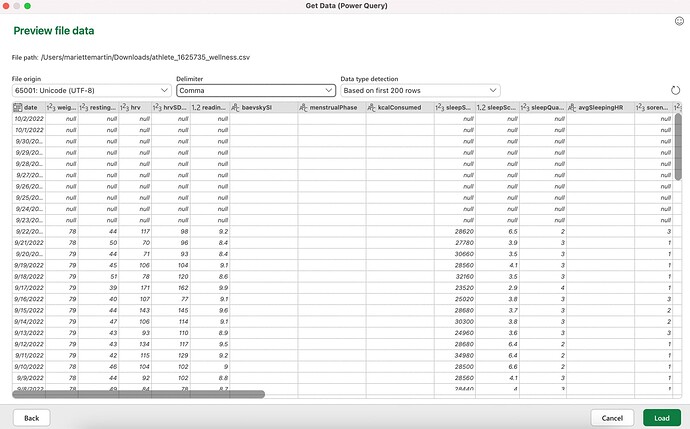
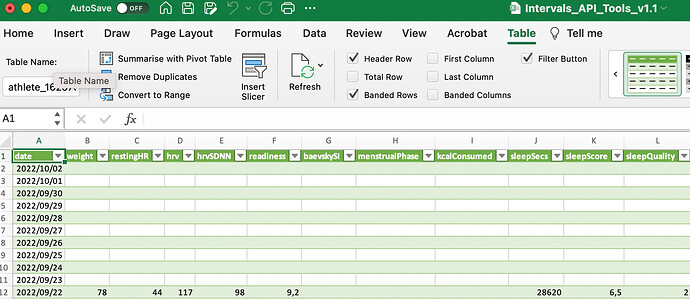
Here are some screenshots from the Mac Excel version:
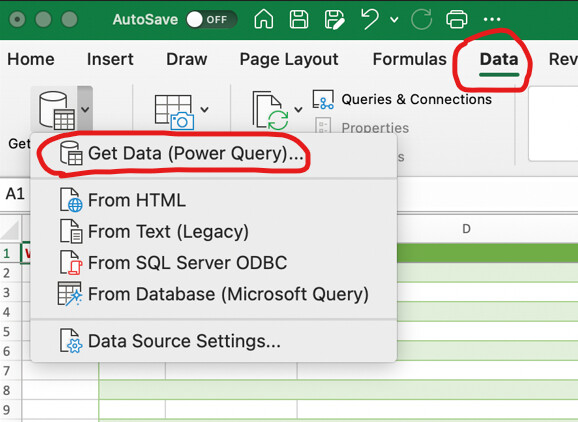
The last step puts it into a new tab, and doesn’t allow me to select the existing Wellness tab. I’m sure the Windows version will allow me to choose the cell to place the data.
Excel Mac v16.xxxx
All i get are these… 
However, I did manage to popualte it manually (had to copy to a new sheet then copy/paste it bac to the wellness sheet)
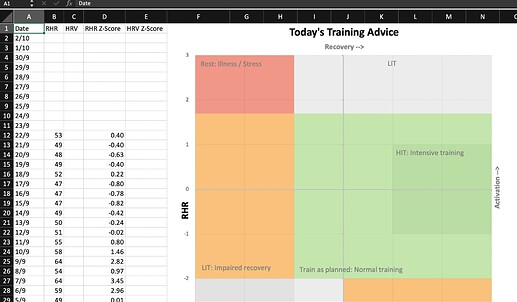
This is the result… So… it seems like since my data doesn’t have HRV (my watch don’t log it), I don’t have any data in for this chart…
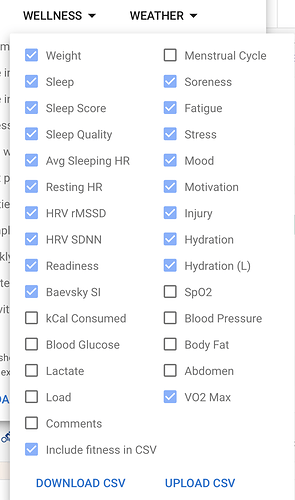
Oh… also, my wellness data CSV is very different… (I wonder if thats cause I didn’t select ALL options?)
You need RAW RMSSD from morning or night measurements entered in the Wellness HRV field . The HRV column on the iThlete tab is already a multiple of the log transformed RMSSD that results in all values being in a range of about 20 to 100. If you use non log transformed data in this chart, the results will be very unpredictable.
If you want to paste data manualy, do it on the wellness tab and not on the chart tab itself.
And yes, if you download the wellness.csv manualy, you will only get the selected values.
If anything that you want to experiment with is not working, first “Unprotect” the sheet by rightclicking on its name. The sheets are Protected with a blank pasword, just to avoid accidental changes.
Haven’t thought of this before, but it should work just as well with SDNN if that’s what you have. Then you need to edit the formula in C2 to get data from the SDNN column on the wellness tab and drag the formula down.
My manually downloaded CSV does not contain any HRV or hrvSDNN values… Hence, I guess this won’t be useful for me since my watch doesn’t support these metrics
Yes… that’s what I did. copied and pasted it to the wellness sheet. (but had to manually move some of the data to the “right” place given my manually downloaded CSV is quite different.)
There is no single watch doing this. You need an app like Kubios, HRV4Training, iThlete, Oura-ring…
Those are the apps that will give you decent morning HRV values. The Garmin “stress” indicator for example is completely useless for this.
I have this, but am definitely not religious in using it every morning…
