I’m posting this in case others find it useful.
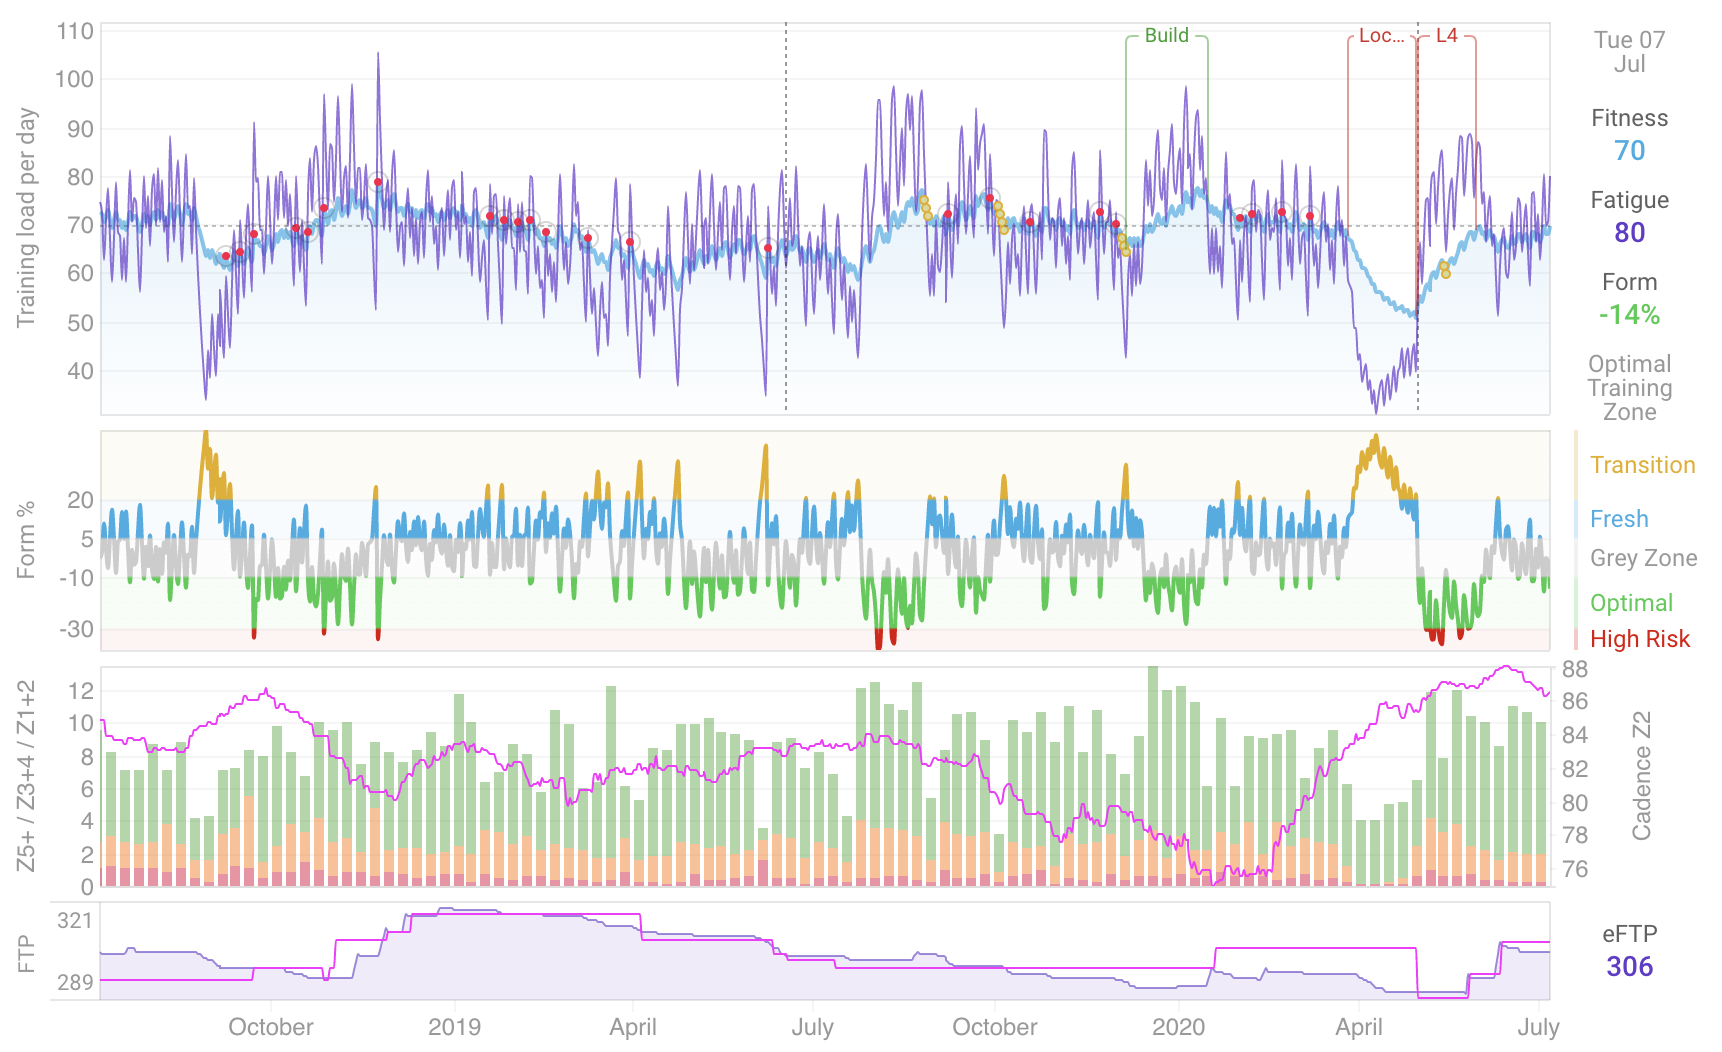
On the Fitness page, one of the most illuminating plots I’ve found is ‘Cadence Z2’, set up as 42 day moving average. I find that this correlates very closely with fatigue (much better than the standard fitness/fatigue/form plots).
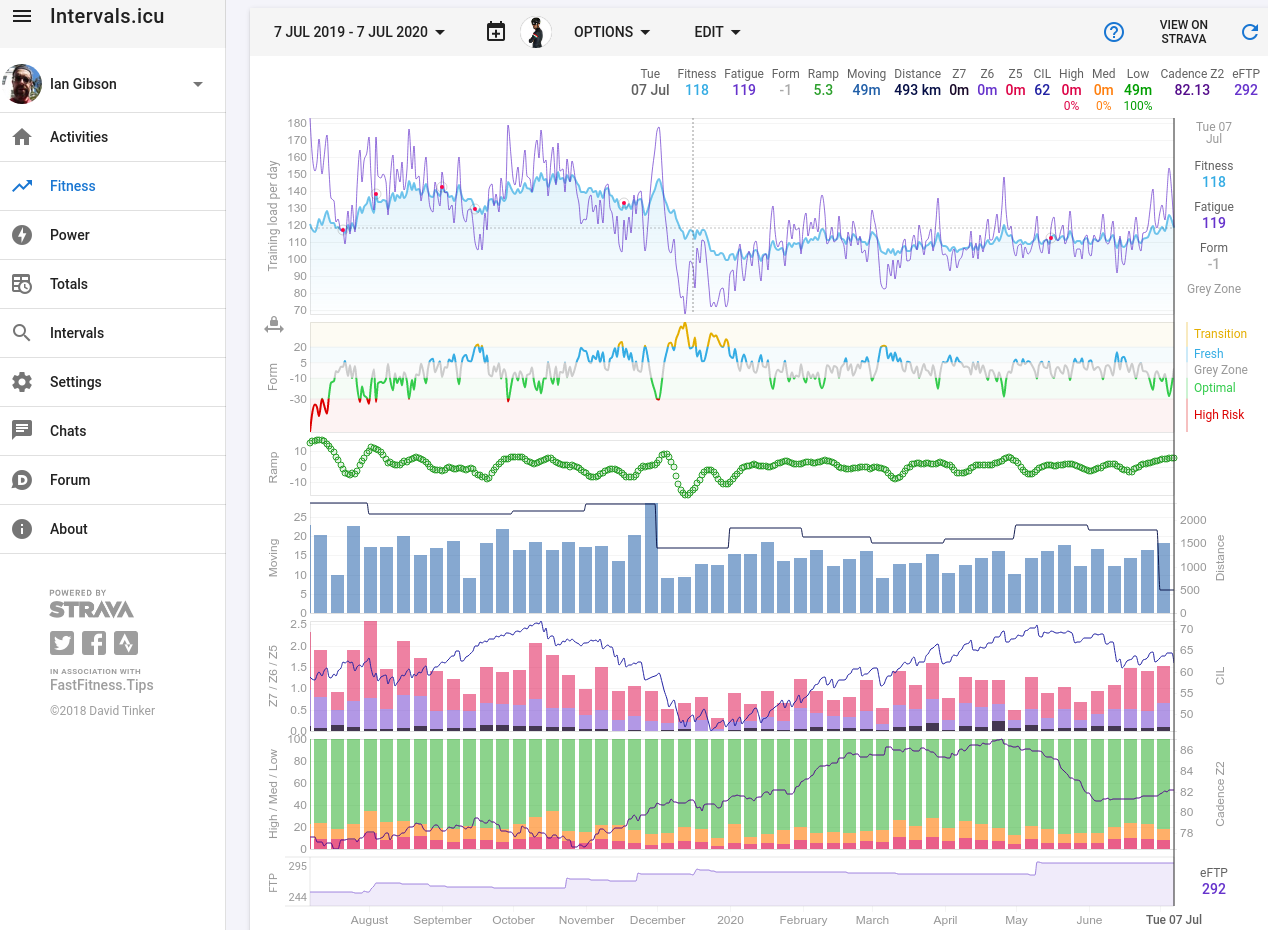
The screenshot shows my training for the last 12 months. The second from bottom chart shows my intensity distribution: high/medium/low intensity are designated red/orange/green, respectively, and the purple line is Cadence Z2 (42 day moving average).
You’ll note that up to December 2019 I was training at a very high volume (averaging almost 2,300 km per month). This made me very tired, especially as I only took two recovery weeks during the whole 5-month period shown. I eventually realized what was going on, and dropped the intensity at the beginning of November and then the volume at the beginning of December (right after I did 5 centuries in 5 days).
But you can see from the chart that my Z2 cadence was very low all through this period: in the mid-high 70s. Then after I backed off and started to recover it climbed steadily, peaking in the high 80s at the beginning of May this year, when I produced my best-ever power numbers.
In the last few weeks my form has taken a bit of a dip, also probably due to accumulated fatigue. And again my Z2 cadence has dropped.
I really think there’s something to this. It seems logical that when you’re tired you won’t pedal as fast as when you’re fresh. I’ve also noticed that my pedaling time while moving tends to decline when I’m tired (i.e. I coast more), which also makes sense.
It would be interesting to know if others have the same experience.