I was listening to the latest TR podcast where they were talking about training consistency, which they tracked using the Coefficient of Variation (CV) of total weekly hours. I was intrigued to see what this would look like for me and thought about setting up a custom chart or something similar in Intervals, but I can’t quite work it out. You can obviously plot the CV of moving_time (daily time, i.e., no aggregation) or sum hours per week, but it doesn’t seem possible to combine both. Might be able to do it with a custom activity field - but that doesn’t seem ideal. Am I missing something obvious here?
1 Like
Could be possible with using a formula
Yeah I looked at that, but I’m not sure the functionality is there. I’d need the function to sum moving_time for the calendar week, and then apply a CV% 84d to the line. The sum per week function doesn’t seem to exist in the formula syntax.
Im interested in this as well, were you able to compute it?
I’ve put together a chart based on this discussion and shared it publicly as Training Variability (12w).
It runs entirely as a native Intervals.icu formula and calculates:
CV (%) = 100 × sample standard deviation / mean weekly hours
It uses the last 12 completed Monday–Sunday weeks, includes weeks with no training as zero, and excludes the current incomplete week. The CV updates every Monday.
I’ve also added weekly training hours as blue bars and background bands:
-
<35%: Consistent
-
35–80%: Variable
-
>80%: Highly variable
All sports are included by default. For cycling only, apply the same sport filter to both plots.
Feel free to try it — feedback welcome!

4 Likes
Hey everyone! I’ve recently listened to the Ask a Cycling Coach Podcast episode #600 – there they shared a new metric called “Training Variability”. Very interesting discussion, they also run some queries on their data and shared some surprising (or not) insights.
From the Podcast Transcript: “Training variability equals spread of weekly hours divided by your average weekly hours times 100. And if you count every week, including the weeks you did nothing over 12 week period, a score of 25 means your week usually lands within about 25% of your average”. There is also a thread on the Trainer Road forum where they discuss how to calculate this.
I’m wondering if anyone here could help build this metric for the Fitness page on the intervals.icu?
There’s another recent post on it
I found an interesting discussion on the recent Trainerroad podcast regarding a consistency metric (the underlying assumption being that consistency is a bigger factor in making gains than pursuing occasional big weeks).
They define a consistency score as Standard Deviation of weekly hours (or TSS) divided by Average of weekly hours (or TSS) for specific Activity Types expressed as a percentage. The formula should only consider full weeks…and would probably be useful to evaluate over a defined range (e.g. trailing 6 weeks, or YTD).
Any ideas on how I could implement this on the fitness page?
TIA
A practical first pass is to plot weekly totals on the Fitness page: Custom Charts → Add Chart, add the activity metric (time or training load), choose a weekly total and filter to the sport types you want. Check the calendar’s week boundaries and take the last six completed weeks, including any zero-activity weeks.
For the ratio itself, put those six weekly totals in A2:A7 in a spreadsheet and use =IF(AVERAGE(A2:A7)=0,“”,100*STDEV.P(A2:A7)/AVERAGE(A2:A7)). That uses population SD for exactly those six weeks; STDEV.S gives a different result if you intend a sample estimate. Keep the unit consistent (all hours or all TSS), and exclude the incomplete current week. A lower result means less variation relative to the average, not necessarily better training or a measure of fitness.
I can confirm that weekly totals can be charted, but I haven’t verified a built-in Fitness chart formula that divides the SD of weekly totals by their mean. The spreadsheet step is a workaround for checking the number, not an automatic Fitness-page implementation.
You can use the shared fitness chart from @Andreas_Schnederle-W
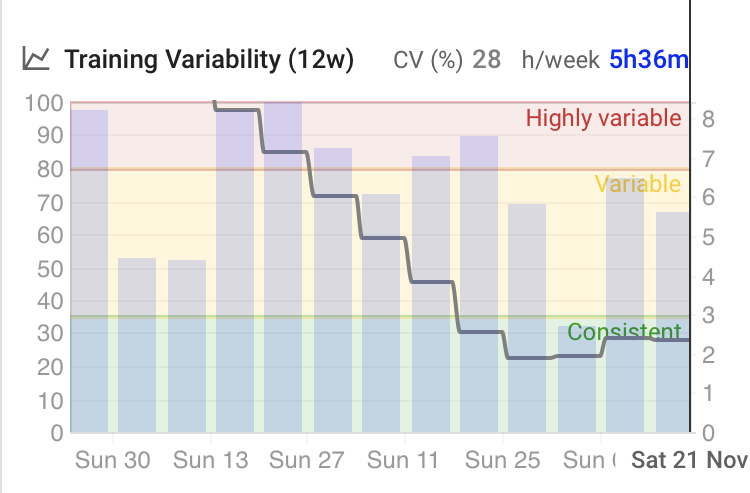
Could you share link to the podcast? I’d like to read more about CV. I have added the shared chart from @Andreas_Schnederle-W and can see line going into green or amber zones over last months so wondering if this is good or bad  Thanks.