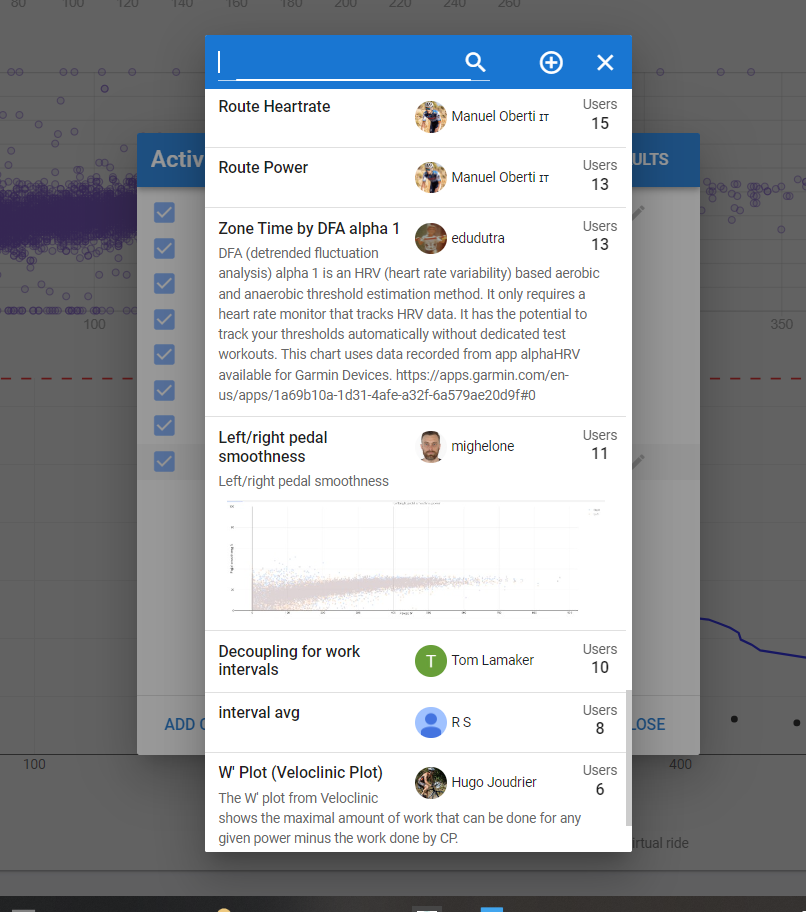
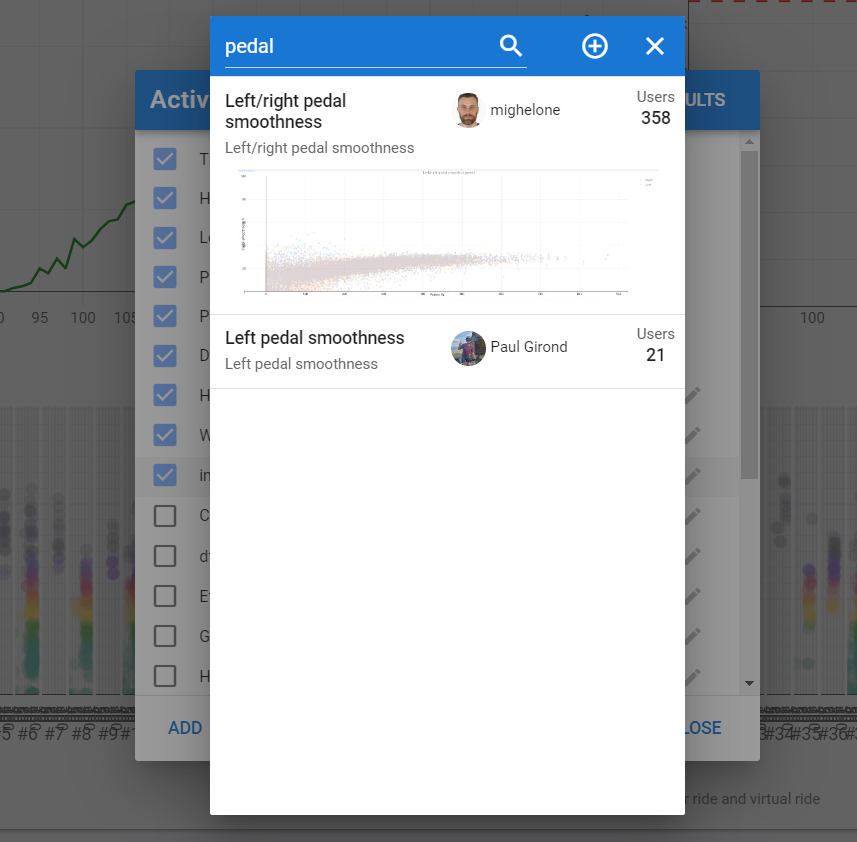
Is there possibility to get chart that calculates torque effectiveness and pedal smoothness as on link below?
That would be really really awesome. I´m not an data wizard and therefore can´t do it by myself.
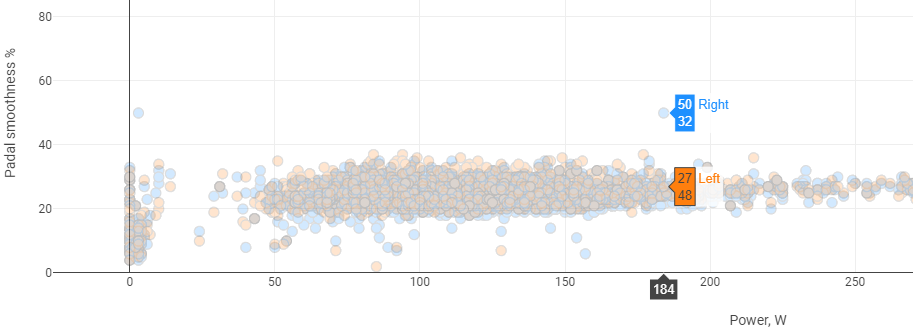
in this example the numbers shown (50/32 for Right, and 27/48 for Left) appears to be the pedal smoothness for right (50%) and left (27%). But what is 32 and 48? From my understanding its neither power nor balance.
many thanks
alfred
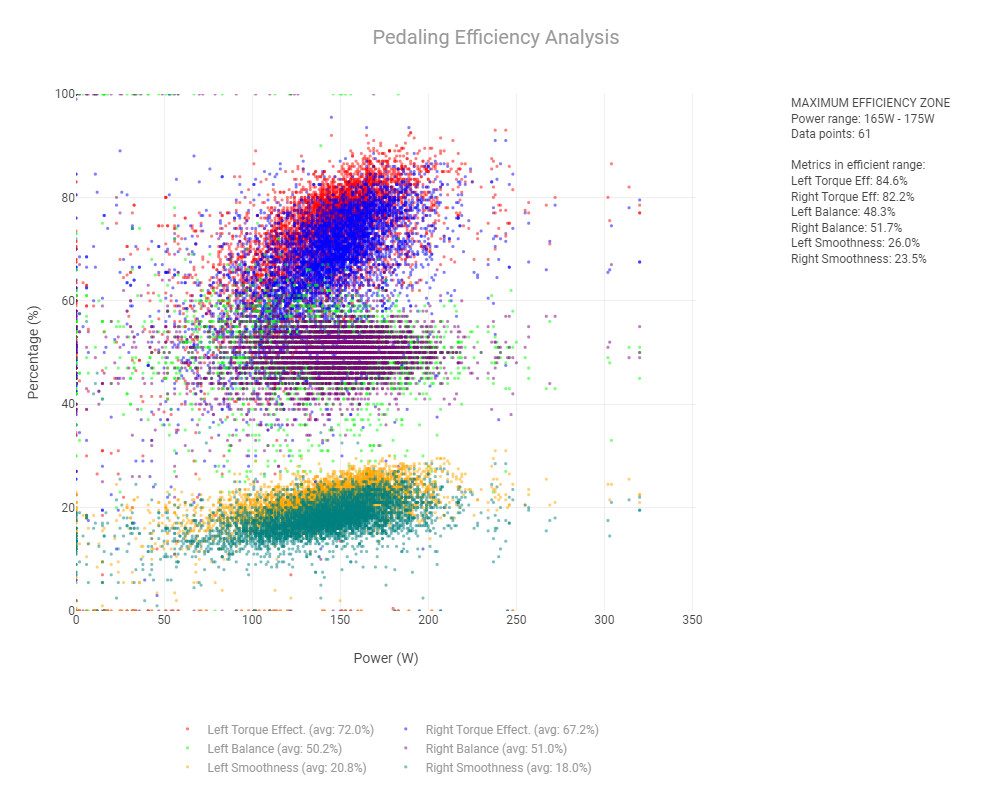
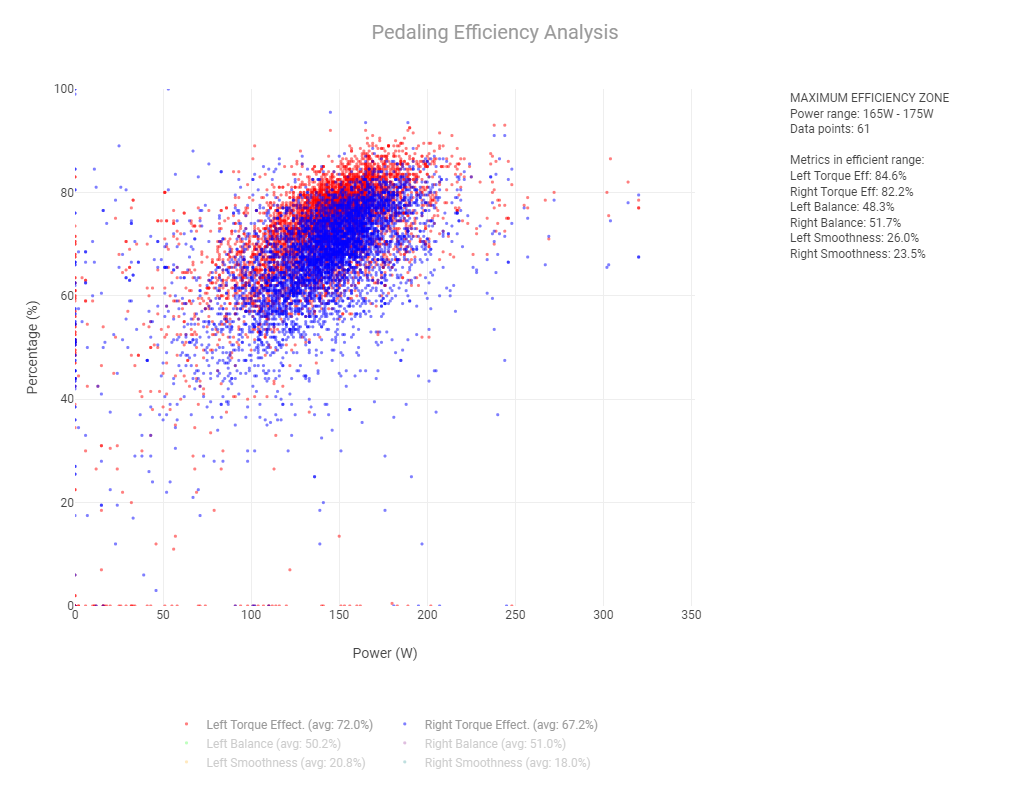
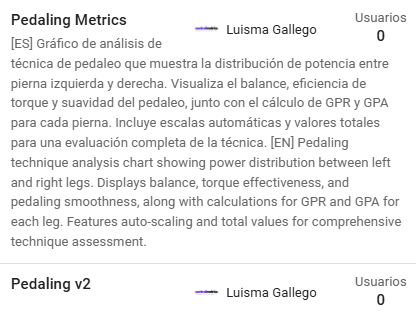
I saw the website that @MedTechCD posted and decided to create this chart where you can see all the metrics together or choose the one you want. On the right, I’ve added some records that show where the athlete is most efficient. I still need to add cadence, and I also plan to see if I can include the averages for each intensity zone to better analyze the technique in each intensity segment.I’ll make it public as soon as it’s finished.
Hmm, thanks @MedTechCD for pointing out the availablity.
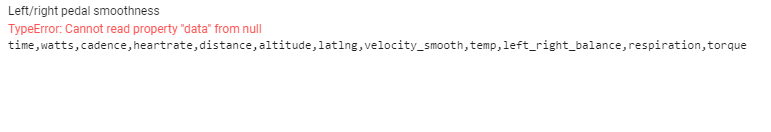
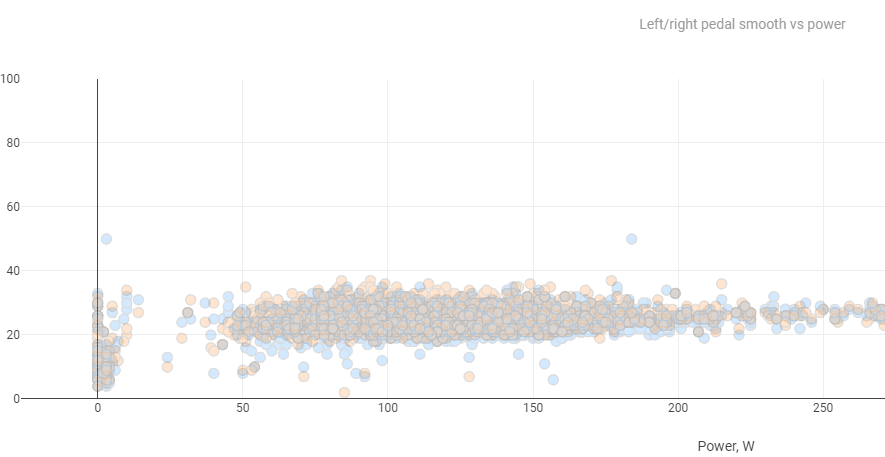
I have tried both charts but none provide any result, (i.e. no chart is shown). Whereas the L/R smooth is shown.
If you look at @Luisma_Gallego_Soy_P recently released graph (go to the bottom and search for keyword ‘torque’), I think we can see the answer. Although the graph you are using indicates torque efficiency at different watts and @Luisma_Gallego_Soy_P is indicating percentages, the data is the same.
The torque efficiency has two parts on each side. The positive torque on the downstroke and the negative torque that same foot’s weight or force has on the upstroke. GPR and GPA. The Efficiency percentage is a formula of the positive torque minus the negative torque and that sum divided by the positive torque.
For me, the value of the charts lies in the negative number, the bottom number, or GPA. The bottom number you are referring to still is somewhat of a mystery though. On some recent short sprints my Efficiency was 96% but that bottom number was 50 but 50 what. Can’t be a percentage. Watts seems the only alternative and that actually makes some sense.
I had no idea I was penalizing my power to such a degree! My SRM power pedals just paid for themselves again.
If I’m not reading this right, please someone chime in.
GPR is the power produced by each leg that helps us move the bicycle in the direction of movement; it is simply giving an absolute value in the form of watts to Torque effectiveness.
GPA is the power we generate but that does not contribute to moving the bicycle; it is negative power. It is the subtraction of Total Power – GPR.
I’m glad the chart is useful to you.
thank you for your answer @Jcmiii.
re to my initial post however,
it is not entirely clear to me. Is the 32 and 48 for right/left now GPA or GPR?
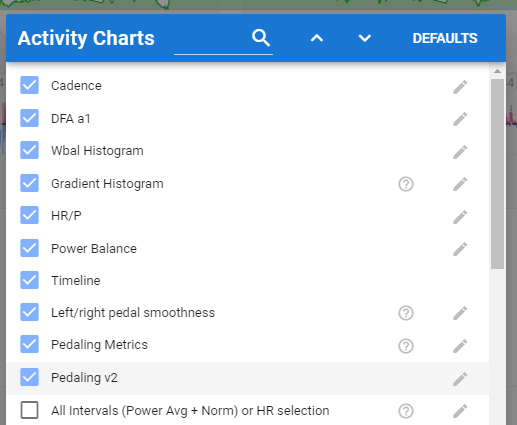
Thanks @Luisma_Gallego_Soy_P for clarification. and also for the “Pedaling Metrics” chart.
As mentioned above, this chart doesn’t show any results for me? Maybe associated with the SRM spider powermeter I am using and NOT dedicated left/right measurement?
thanks
Hello, check which version of the chart you have, I made some modifications, let me know here and if you don’t have the current one, I’ll send you the code so you can update it.