First of all: Great work - love seeing how this platform grows!
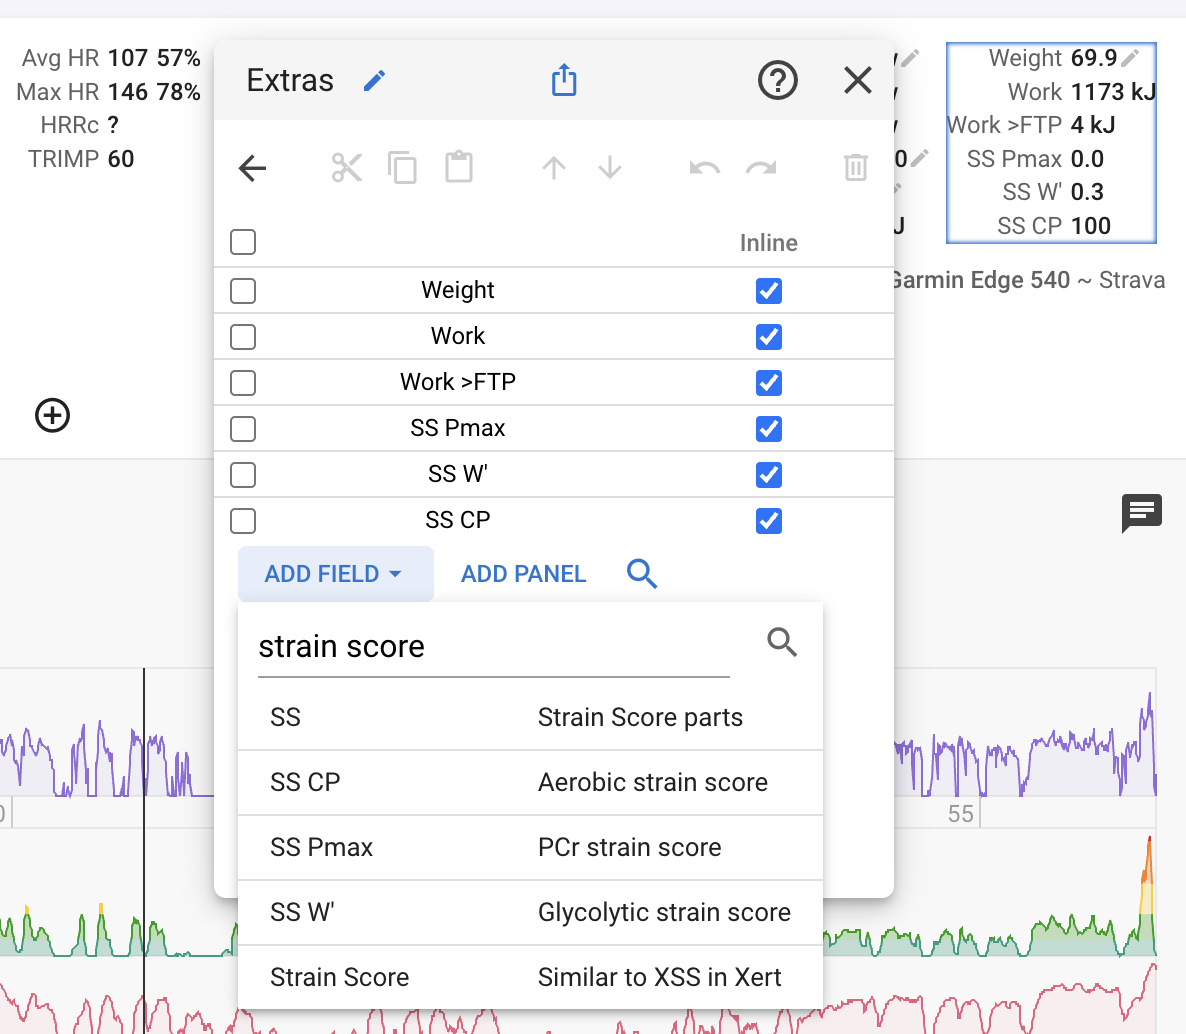
Regarding the implementation: on my mobile device (iPhone) the settings option of Pmax and the Strain Score within the Load pop up are visible, but on my laptop they aren’t (MacBook).
Additional info (both accessed with Safari):
Laptop: Version 2025-07-16 04:51:05
Phone: Version 2025-08-10 14:30:37
Tx. Your laptop version is very out of date. Try hard reload the page (shift-reload or control-reload), wait a couple of minutes and then switch to a different tab. The app should reload itself with the new version.
Can you make it possible for manually added activities/workouts for the Strain Score to be reflected in the Fitness graph and Activities summary (main page), which you can add when editing the layout on the left side.
Your Pmax for that activity is much lower than what you actually did. The calculation should clamp things to avoid negative for anything but the numbers will be wrong in any case.
Hi there!
I just went through all your fantastic work and would really love to make the most of it.
One thing I keep wondering, apart from where to look or how to use the insights from these new fields/charts, is this:
Could this functionality also give us more “ready-to-use” fields — for regular folks, us mere mortals — kind of like the “Fueling Insights” in TrainingPeaks?
Not sure if this topic should stay in this conversation or spin off into a new one, but I think it could really help with the use and understanding of these calculations.
Tx. This work isn’t quite done yet. The plan is to write-up a guide forum post summarising the paper and explaining where to see everything in Intervals.icu.
You need to set a W’ value as well. I filled in 16000 (from your running power curve) on that activity. I think the numbers are correct. Your power was only above FTP for a very short time, hence everything is aerobic (SS CP).
Sorry for bother you again David, how ss , ss_cp etc. is calculated ? i mean which columns he “searching” for it - some acitivities i get irreal values, with some activities like: Intervals.icu
I’m interested to use these metrics in my trail run plan for my next A race in March (80k trail race). I have started a 21week plan (home made). For now, I have built all workouts in Stryd calendar, so I have some predicted RSS values and overall weekly totals, to see the ramp up, reocvery weeks, etc.
I’m trying to understand the new metrics how they “compare” with what I’m used to (the Stryd ecosystem). My biggest challenge is as my typical week is mixing activity types (runs on road, trails, workouts, hikes/walks) how to calculate an overall load for a given week, and how to predict future weeks to reach “form peak” on the race week or ideally on the day
If anyone out there has successfuly used these metrics to do that, I’d be interested. I’ve also ordered the new Stryd 5.0 pod which is normally better for trail runs so I’m going to test accuracy of the new hardware in coming weeks when received.
Intervals.icu calculates those whenever an activity is analysed so any changes you did make would be overwritten. You could add your own custom activity fields instead.
I’m also trying to figure out how to incorporate these new metrics in my “home made” training plan… for indoor rowing. So far I have found that Strain Score is generally higher than Power Load (TSS) for Zone 2 type training, about the same for Z3 and lower for Zones 4 and 5. To “score” each day’s work I am using whichever number is higher. This works for measuring compliance with the plan, especially since I do a lot of Z2 but I need to figure out how best to incorporate SS in the Plan going forward. I would need to adjust the load targets for Z2 to account for the higher SS score. I’m thinking, with enough data, I could come up with a percentage adjustment that would account for the difference.
With Seiler’s three zone theory in mind, I am also tracking the cumulative (weekly and per Meso) CP, W’ and Pmax values to get a feel for the relative distribution of training.
Anybody have thoughts on the validity of this approach?
It would be great to hear how others are using these Strain metrics.
I don’t particularly use these metrics, but I do calculate the metrics and use the models. I don’t know how to do this with intervals, but this is how I do it.
You need 90-120 days of data to build the Bannister IR model to predict performance. 4 models are needed if you read the Xert paper…one for total strain, CP strain, W’ strain, and Pmax strain.
Ideally, you need solid CP , W’, and Pmax data. The Xert scoring system is different from Stryd RSS, but in a good way.
Real max efforts are needed to build your MMP curve. Routine time trials are needed that can be used to fit the model data. This helps in the future performance prediction. If you train more and CTL or PTE increase relative to ATL or NTE, then performance should increase.
You can use intervals to calculate the four different scores from the Xert paper. I use my own spreadsheet. Then I use a spreadsheet I made for the Bannister IR model to track my daily data and time trials, and fit the model parameters to the data. Once I have a good fit for the model, I can use the model to predict future performance based on a training plan.