Is it possible to visualize Strain like that using a custom script?
Is it possible to visualize Strain like that using a custom script?
should they match up with Xert?
Xert:
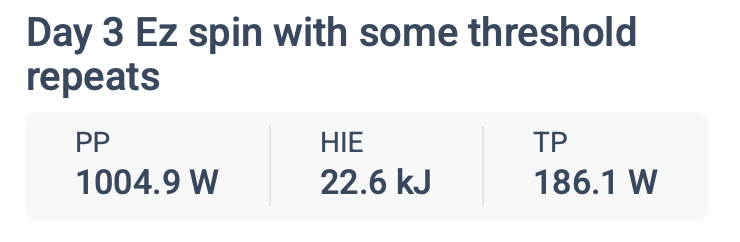
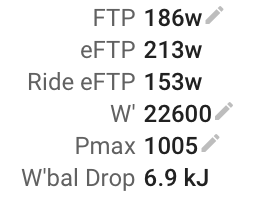
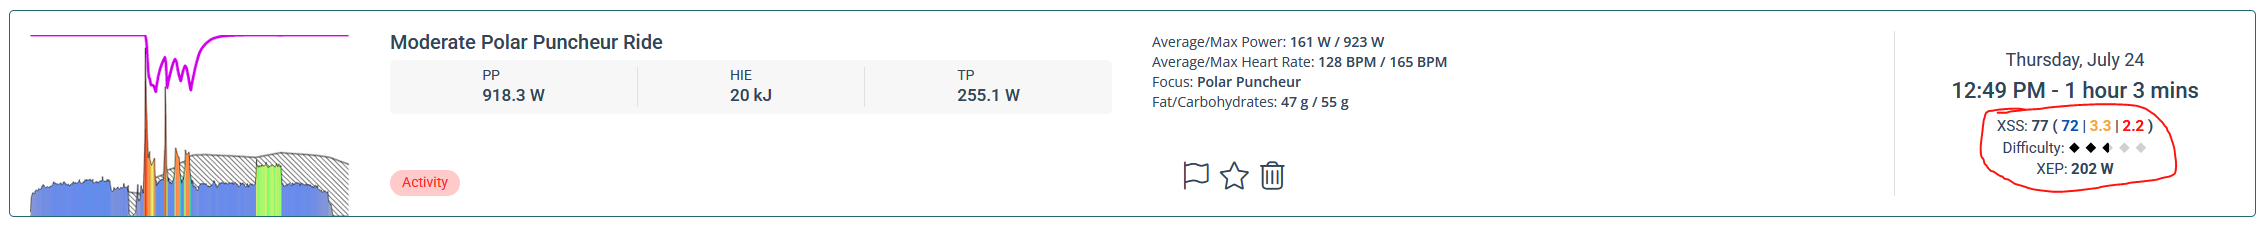
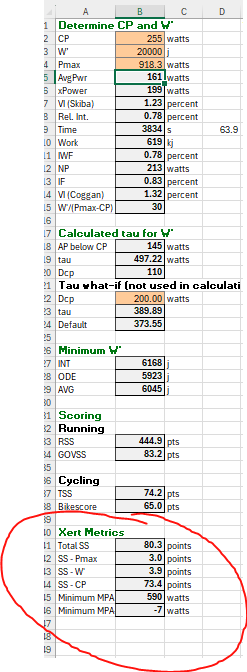
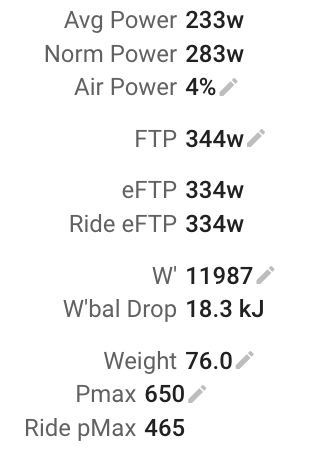
Intervals where I set FTP, W’ and Pmax to match Xert:
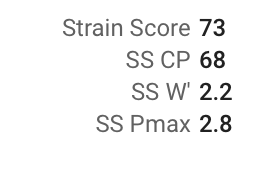
Pmax is high 2.8 Intervals vs 0.9 Xert. Aerobic and glycolytic look fine.
I think Xert is using a modified version of the model in the paper. So I would expect some things to not match exactly.
Firstly, the content of the research isn’t exactly what is implemented in Xert. We have made a number of improvements but the foundational principles are the same as what is in the paper.
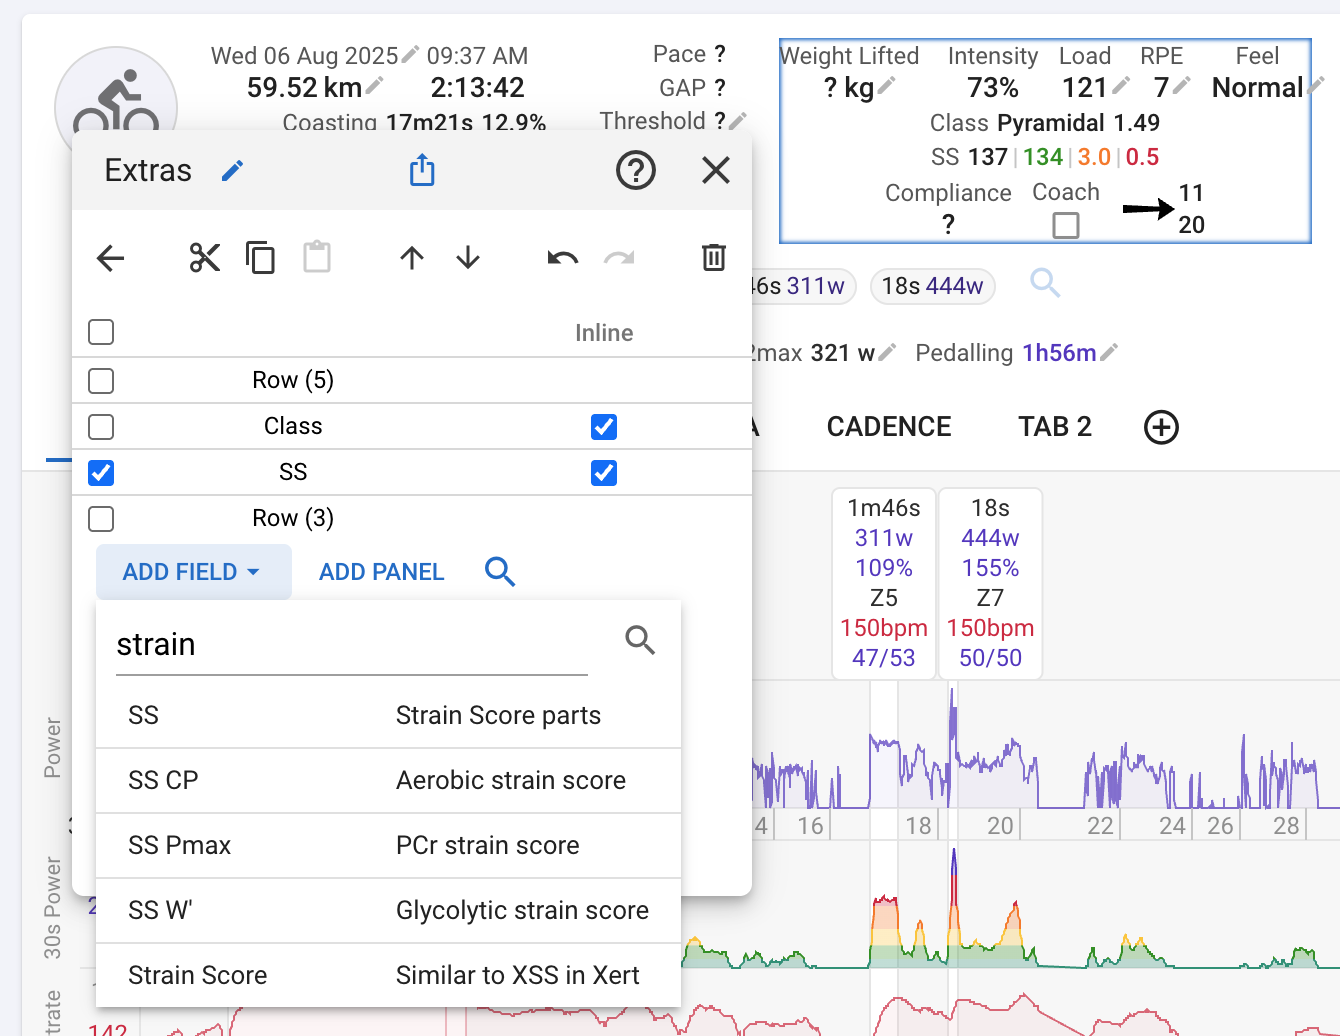
You could, with 4 custom fields each with different colours. But we will very likely implement similar presentation soon.
My workouts are basically identical to Xert (for the ones I’ve looked at). At least good enough for government work.

Thanks, David. I made a clunky, bug-ridden python app for this analysis and now I can throw it away.
Looking forward to the Bannister models.
No offense, but by default Intervals thinks my power data has spikes and tries to fix them. So I’m always suspicious of Intervals when it comes to things like skewing the PCr / Pmax strain scores. Because I don’t know if behind the scenes, Intervals is playing games with the actual recorded / good data. Along the same lines, Intervals likes to create data if there is missing data (for example the Garmin vs Intervals discrepancy).
So without writing some code to test the SS Pmax algorithm from the paper, I’m suspicious of Intervals first.
Again no offense, but I’m not a fan of creating data because it can have side effects starting with getting different answers from different analytics.
Upon looking more closely, the numbers are off a little from Xert. Intervals seems to match my spreadsheet, though. Maybe not a big deal?
intervals
You can turn that off in /settings. As soon as you do any automatic power modelling like eFTP (and this thread) you have to try to detect bad data. It just takes one bad ride to throw everything out.
This is great - as an Xert user but someone who like the open nature of Intervals, I love to see this. Will we have the option be able to change the default “Training load per day” chart on the Fitness tab to use this strain score rather than the default load? At the moment I don’t think we can edit this chart at all?
Thanks
A
There are two parts to that. The first is an option to use strain score for training load instead of power load (TSS) for rides with power. That’s easy and will be available soon.
The more complicated part is implementing the 3D impulse response model (tracking each energy system component separately instead of a single number). That doesn’t mesh well with multi-sport, but nice for people who only do cycling on the endurance sport side and have power available always.
And, @david , while you’re implementing options for the Training load per day fitness chart, could one of the options be kJ per day?
Ta.
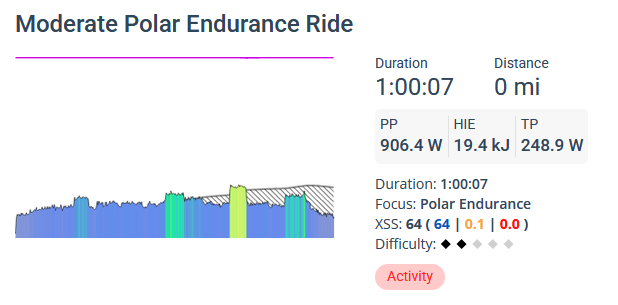
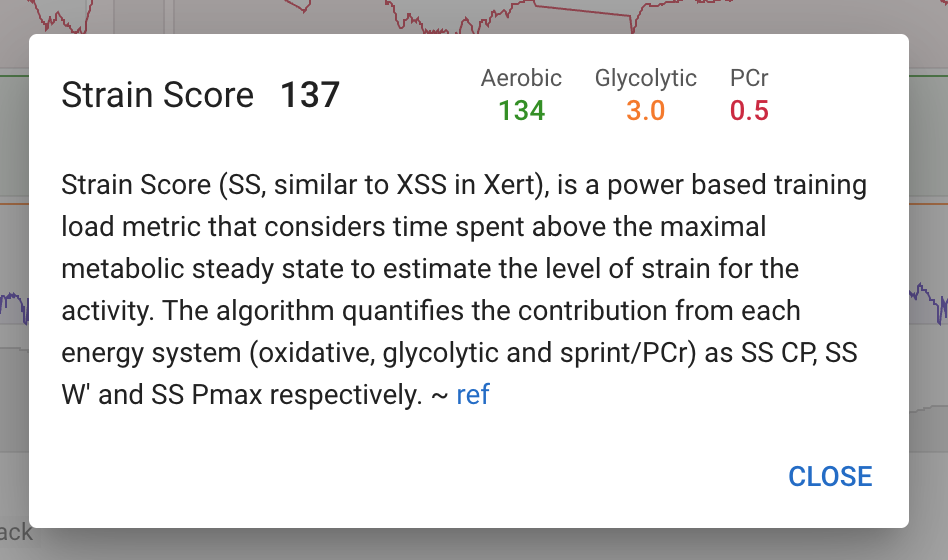
We have added strain score to planned workouts (see bottom right of screenshot):
Click it to get help:
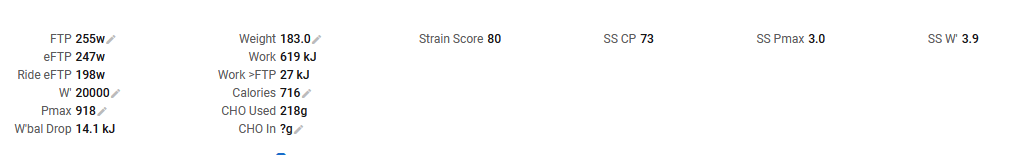
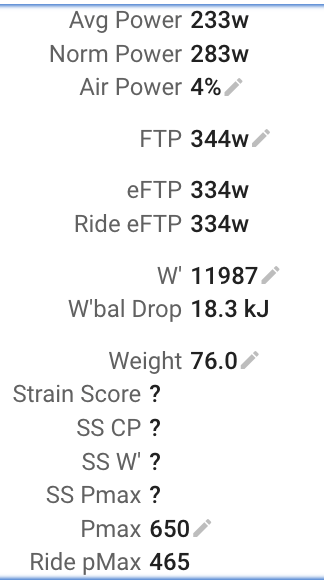
You can also add it to the activity summary layout. It will likely go in the default layout when more complete. Click Actions → Edit Summary:
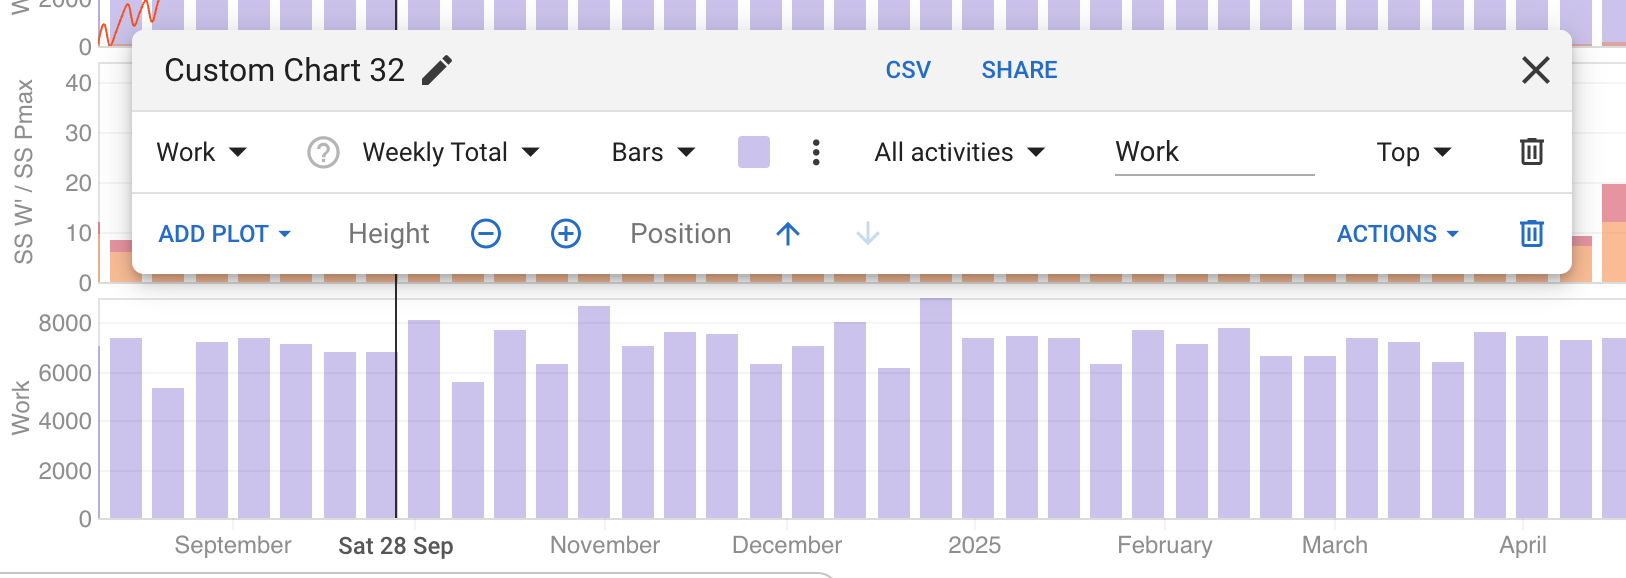
You can plot that on the /fitness page with various moving averages and so on.
Yeah, I do that, but the one training load per day metric that is unalterable and that appears at the top of the /Fitness page is the TSS based one. It’s the option to change that to a kJ basis that I was asking about.
Very interesting. I’m able to add the charts, but I don’t get the summary layout to work. They fields are there, but they don’t show up when I close the summary editor.
In the editor:
After closing the editor:
Re-analyse that activity to make sure the fields have been calculated. Also those fields are only displayed for cycling. Maybe I should relax that?
It has been re-analyzed. But, it’s a run activity so that’s the problem. Would this analysis only work for cycling?
It will work (you will get numbers) but I am not sure how applicable it is. I suppose Intervals.icu is already using the 3 parameter power model for running so might as well turn this on for all sports. Done.
Thanks. Will check it out. It requires that you run with a power meter, of course.
When will the change be deployed? It still doesn’t show up.
A minor feedback: There are two fields that use the word “ride” in them that are actually available to multiple sports “Ride FTP” and now “Ride Pmax”. Since these are available for more than just cycling, a better wording would perhaps be “Session FTP” and “Session Pmax”?
Sorry I forgot to update part of it. You can now re-analyse any sport with power analysis to get strain score.
The correct wording should be “Activity eFTP” etc.. Of course that takes up more space ![]()
SS is translated into French as ‘Sweet Spot’. Shouldn’t the acronym instead be translated as ‘Score d’effort’?"