would it be possible to log daily metrics such as mood, motivation, sleep quality, muscle soreness?
thanks
1 Like
Yes I am planning to add all of those things soon. Almost done with Garmin Connect integration! Been holding up other features …
7 Likes
Sweet. Thanks for your hard work👏
And HRV hopefully!
1 Like
Will be interested to see how the Garmin Integration works for those using strava and garmin!
Possibly too early to know, but it would be awesome if Intervals could import running power data directly from Garmin, which doesn’t make its way to Strava - I understand this is because it is saved in a different field within the FIT file to the data from cycling power meters.
I have started working on this. This is what the record for a day looks like so far:
public Float weight;
public Integer restingHR;
public Integer hrv;
public Boolean periodDay;
public Integer kcalConsumed;
public Integer sleepSecs;
public Integer sleepQuality;    // Poor(1), Avg(2), Good(3), Excellent(4)
public Integer soreness;        // None(0), Low(1), Avg(2), High(3), Extreme(4)
public Integer fatigue;         // None(0), Low(1), Avg(2), High(3), Extreme(4)
public Integer stress;          // None(0), Low(1), Avg(2), High(3), Extreme(4)
public Integer mood;            // Poor(1), Avg(2), Good(3), Excellent(4)
public Integer motivation;      // Poor(1), Avg(2), Good(3), Excellent(4)
Please let me know what is missing + any other suggestions/improvements.
2 Likes
Hi David,
It could be nice to choose mood and sensations by using the scales from fred Grappe you can find here at page 73 (sorry, it’s french and not english) : https://www.fredericgrappe.com/wp-content/uploads/2013/09/Quantification-CE.pdf
So after chosing notes for mood and sensations, we could determine the fatigue who is : fatigue = (sensations + mood) / 2
So, it could be possible to follow stress load and impact on fatigue as you can see at page 74. If you need more informations, don’t hesitate to tell me 
Thank you!
Chris
I have done something similar so far but with smaller scales (1-4 instead of 1-10). What is “sensations” more or less? This is what the capture dialog looks like at the moment:
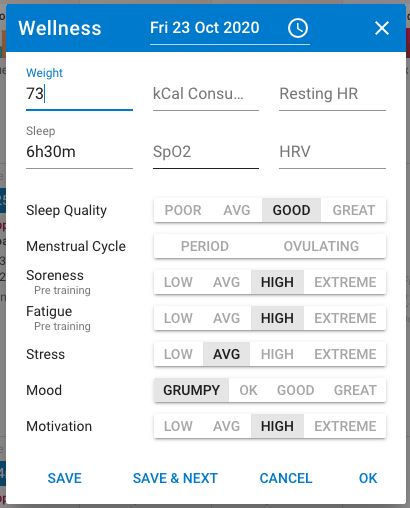
3 Likes
I know you’re working on Garmin Wellness integration as well, right? does this mean that some of these metrics may come from there (like sleep quality or stress)? thanks!
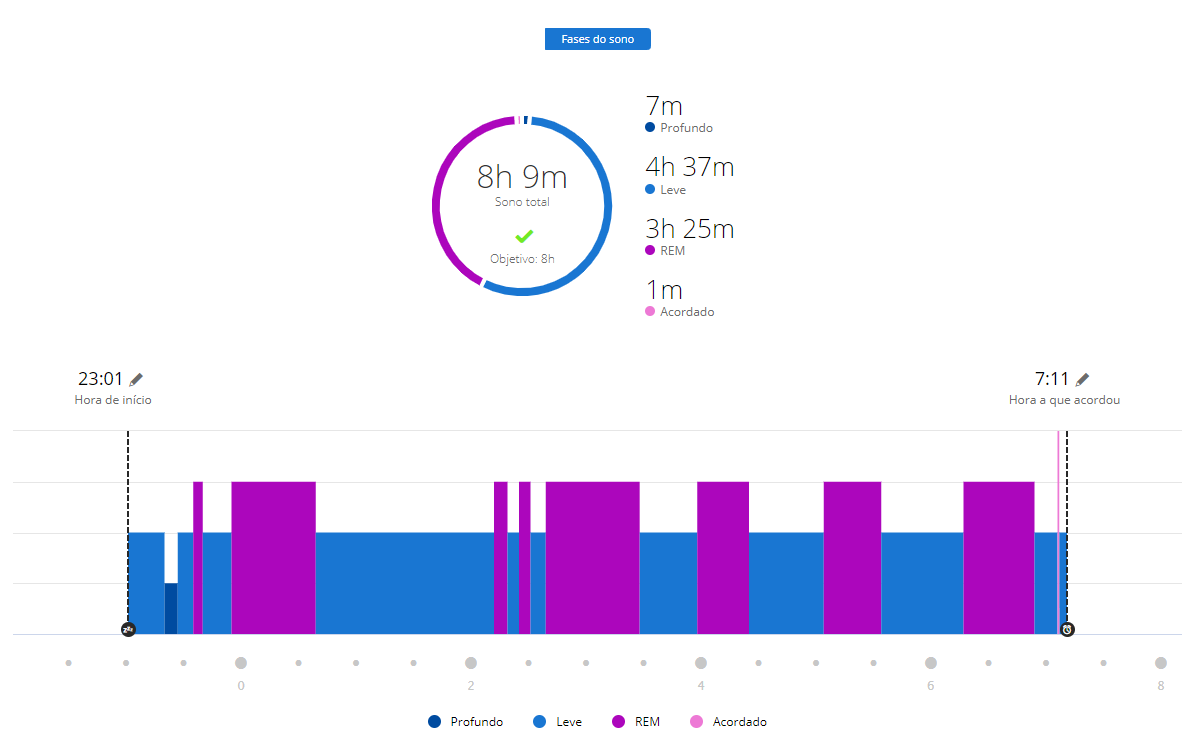
Thats correct. Sleep quality might be a bit tricky because I need to turn this info into a 1-4 quality score somehow:
“deepSleepDurationInSeconds”: 11231, “lightSleepDurationInSeconds”: 3541, “remSleepInSeconds”: 0, “awakeDurationInSeconds”: 492,
Thank you David for your response.
I think “sensations” and “mood” must be completed into each activity report like RPE with a scale of 1-10. I think it’s interested to keep the same scales that are usually used by many coaches. This is the scale for sensations and mood :
SENSATIONS :
1 - super form; great desire to go to train, to compete; excellent sensations with the effort and recuperation.
2 -
3 - acceptable form, sensations and recovery
4 -
5 - variable sensations and recuperation for various reasons
6 -
7 -
8 -
9 -
10 - exhausted, no desire to do anything during the day, very bad recovery in generalScale
MOOD :
1 - in a very good mood, very happy
2 -
3 - property
4 -
5 - relaxed
6 -
7 - anxious
8 -
9 -
10 - depressed
Hmm. I am trying to keep this simple and quick for athletes by using smaller scales (1-4). But I do have the “good” end of the scale on the high side (4). I will swap that around so a bigger number is worse for plotting against training load like in the PDF. I can do the same calculation as Grappe, just the scale will be different, or I could map the 1-4 to 1-10 for the calc. Will likely have the same result.
4 Likes
I don’t think It will be more simple because of a scale 1-4, 1-10 scale just let the possibility to be more precise from one day to another when the change of sensations or mood is just a little bit higher or lower. But maybe it’s a big work for you to change the scale from 1-4 to 1-10, so it’s already well to have the 1-4 
Thanks again for your great work!!!
2 Likes
I actually think 1-4 makes life a lot easier. Generally you can go for one of these without much thought, but I spend ages working out what number I should pick on 1-10, and I doubt I apply it consistently.
5 Likes
I think you are spot on David. It is easy spending more time looking at the Borg 1-20 scale than actually answering it. Having used the Perceived Exertion in school as a guidance for training, there is a question of how to look at it over time. I have no suggestion, but expect you to be able to make a simple graph showing how training went based upon how we felt.
2 Likes
The first version of this is live now. Add a calendar entry and choose “Wellness” to capture data. Currently info is only displayed on the calendar (click “Options” and then “Wellness” to choose fields). Will be adding to the /fitness page soon.
5 Likes
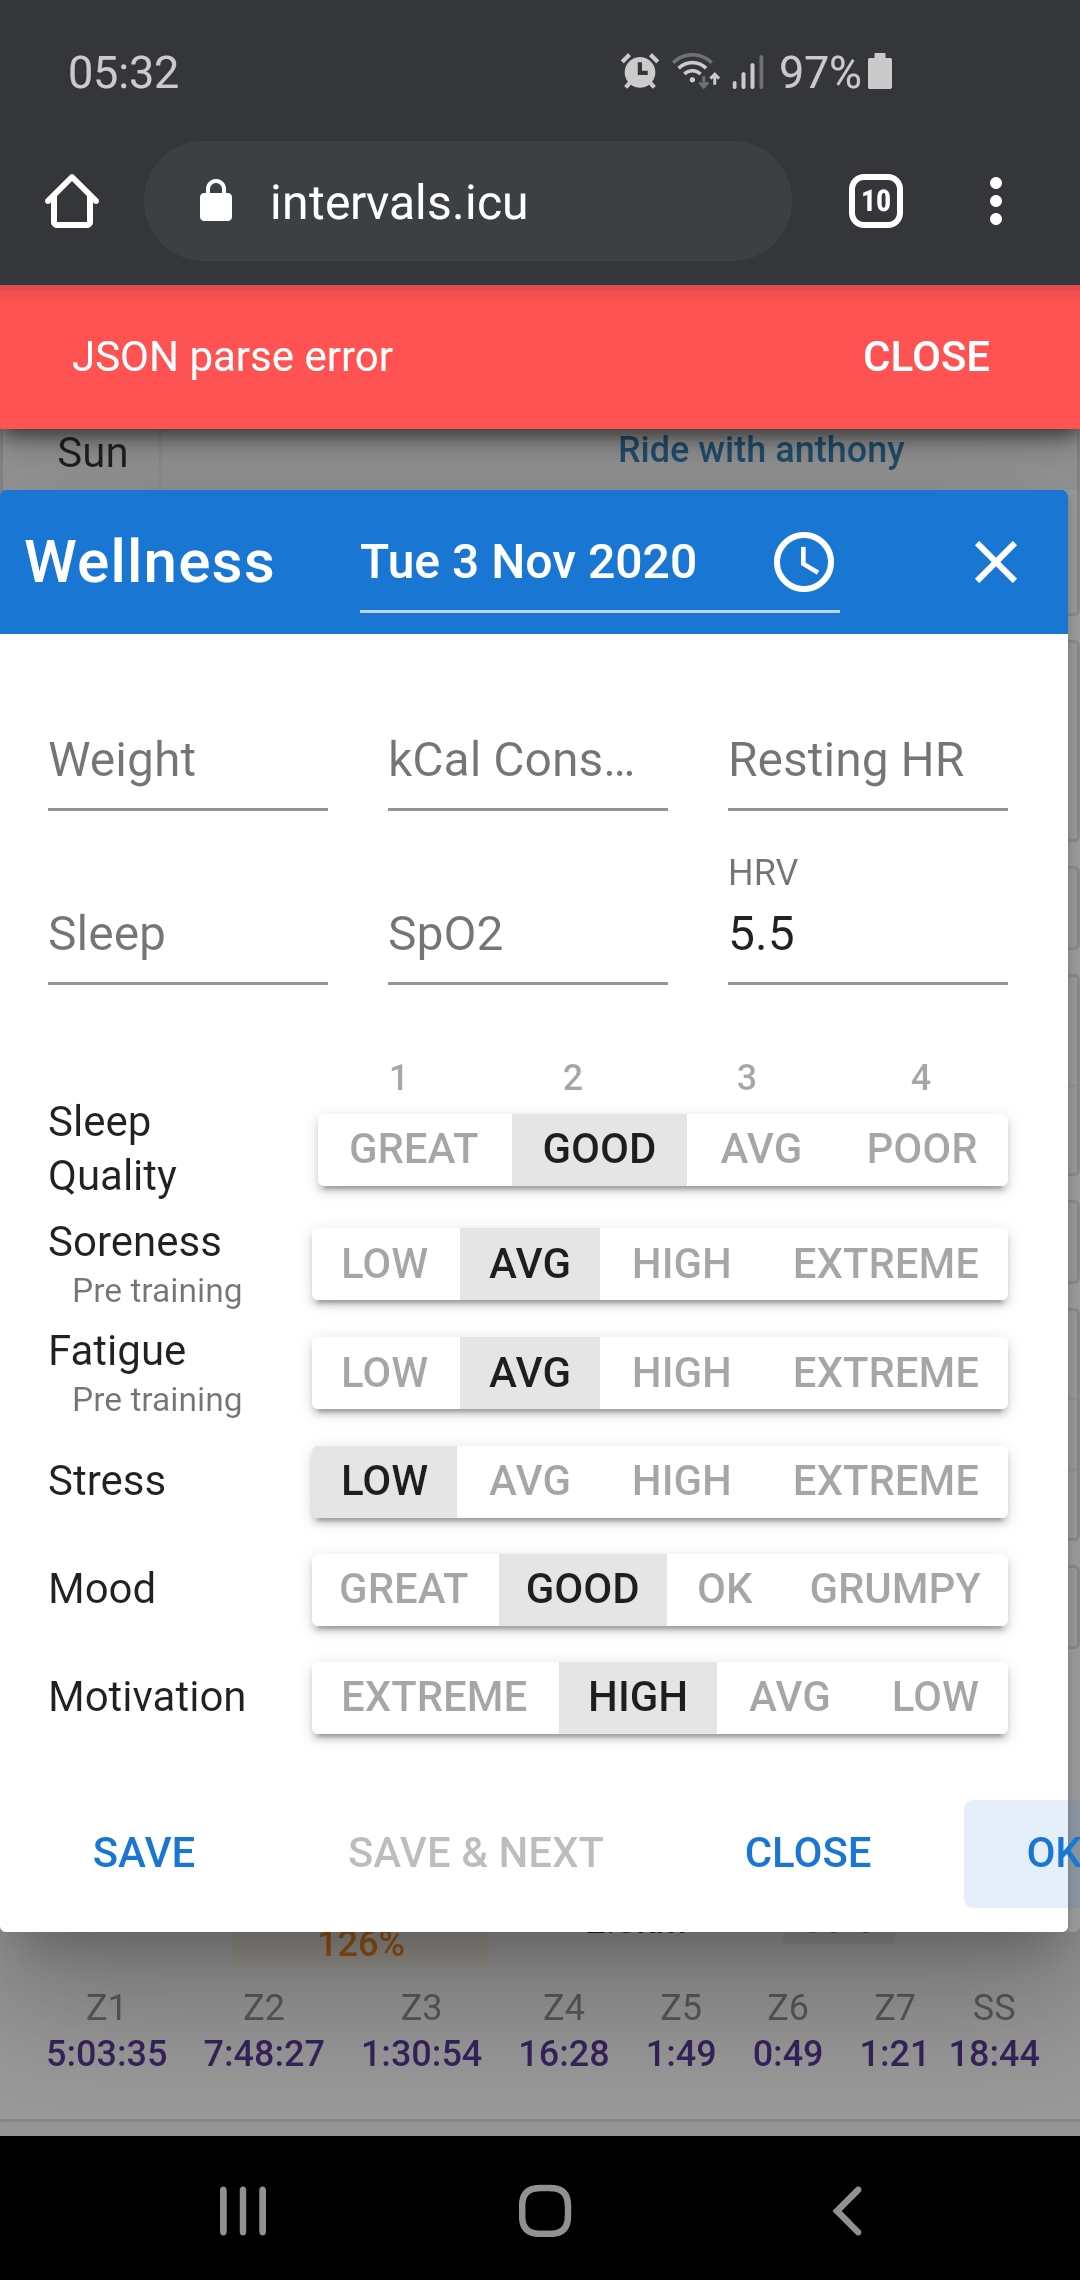
I’m getting this message after inputting wellness metrics: JSON parse error.
thanks for developing this feature though
Hmm. Can you pls send me a screenshot of the dialog. I did find and fix another error but haven’t managed to reproduce “JSON parse error”. Tx.