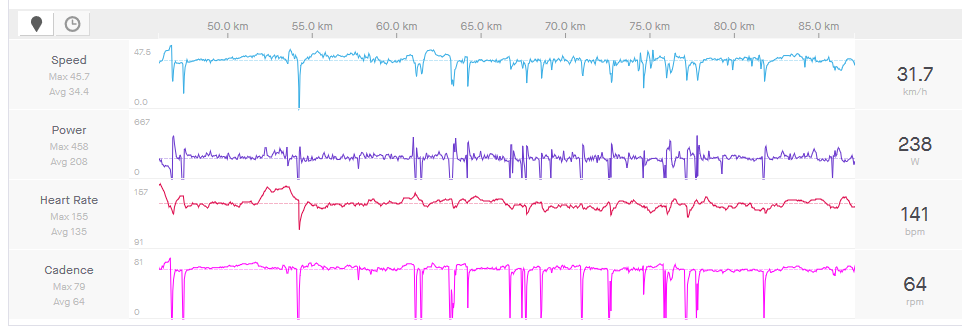
The decoupling trace now uses the power % scale (i.e. right hand y-axis)
Zero power points get a decoupling of zero which helps reduce the effect of stops and downhills. Those were getting 100% decoupling before which is obviously bad.
The “1st half ratio” used as a reference for decoupling is now the first hour (after warmup) or the first half whichever is smaller
I fixed some bugs with the warmup/cooldown not always being properly applied
I think, David, that in your graph above your blue line is actually HR / power. Decoupling means that HR rises relative to power.
I also think that if you are using a baseline hour or half ride, then the warmup slider should not be applied to this analysis.
Do you think that the scale on the right hand axis should be smaller – eg go from 0 to 50? After all, a decoupling score of 50 would be huge: you’re either dying or barely crawling along!
Oh, and is there a global setting for resting HR? Or is that something I should check every morning before a ride?
The problem with messing with the right hand scale is that it is also used for power %. If I make decoupling fit a different scale then it needs its own chart or a 3rd y-axis (yuck). I like the fact that it doesn’t interfere with the main power and HR data.
You can set default resting HR in /settings, on the 3rd line of options near the top of the page.
There is, as @David pointed out, but you should make it a habit of checking that frequently when you wake up, because it can also be an indication of things (you) going wrong. Ideally, you have a tracker or a watch that does that automatically each morning, otherwise just check it manually every now and then…
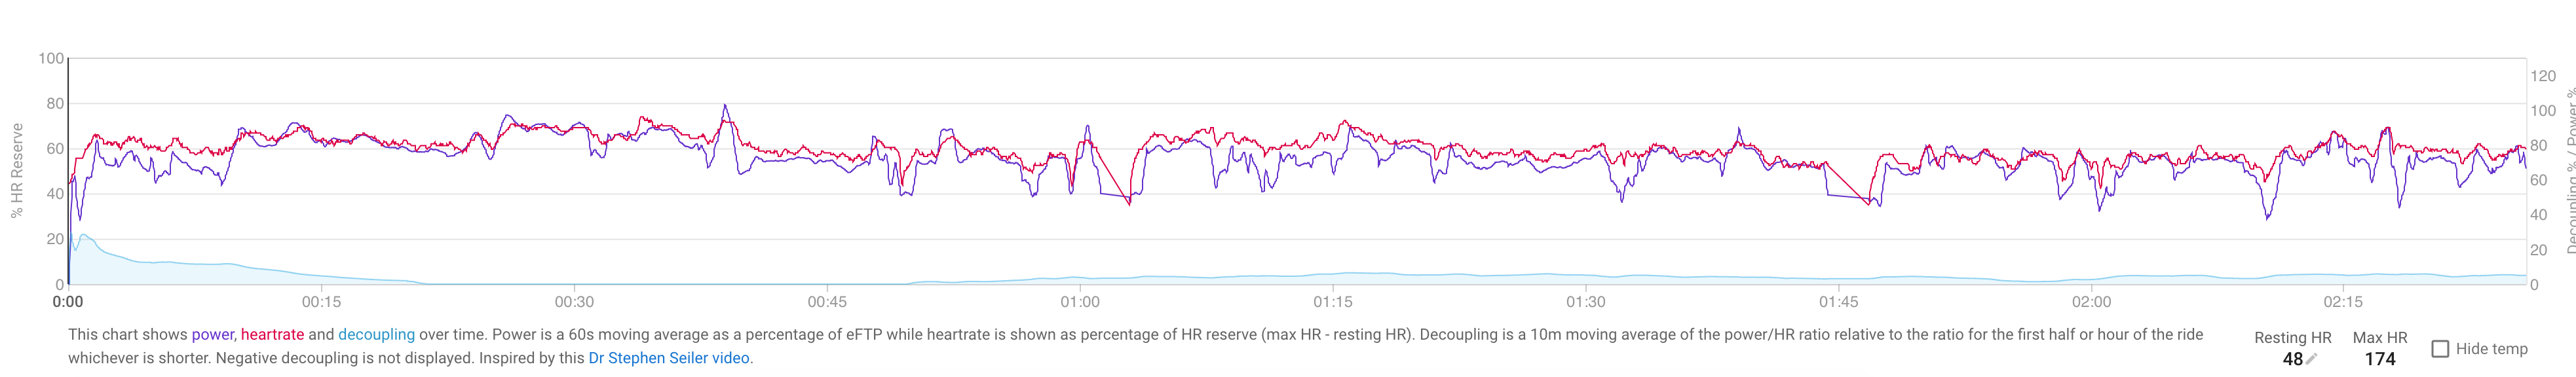
For those durations you have very little decoupling going on so your aerobic base is good (for those durations anyway). The decoupling number higher up on the page should agree. It will be a bit different because it does more sophisticated selection of data points and corrects for HR lag.
Those rides weren’t ideal since I usually go pretty hard In a group ride/race for the first couple of hours before settling in to Z2 for the last two, so by the end of it it’s good and uncomfortable. Looking at longer, more aerobic rides it lines up as I’d expect it to.
Just thought I’d share my most recent LIT ride. Great visual representation of it David. I’m going to have a look back at some of my other similar rides but it shows what I generally feel that I start to decouple around the 2 hour mark on these type of rides. Absolutely brilliant feature
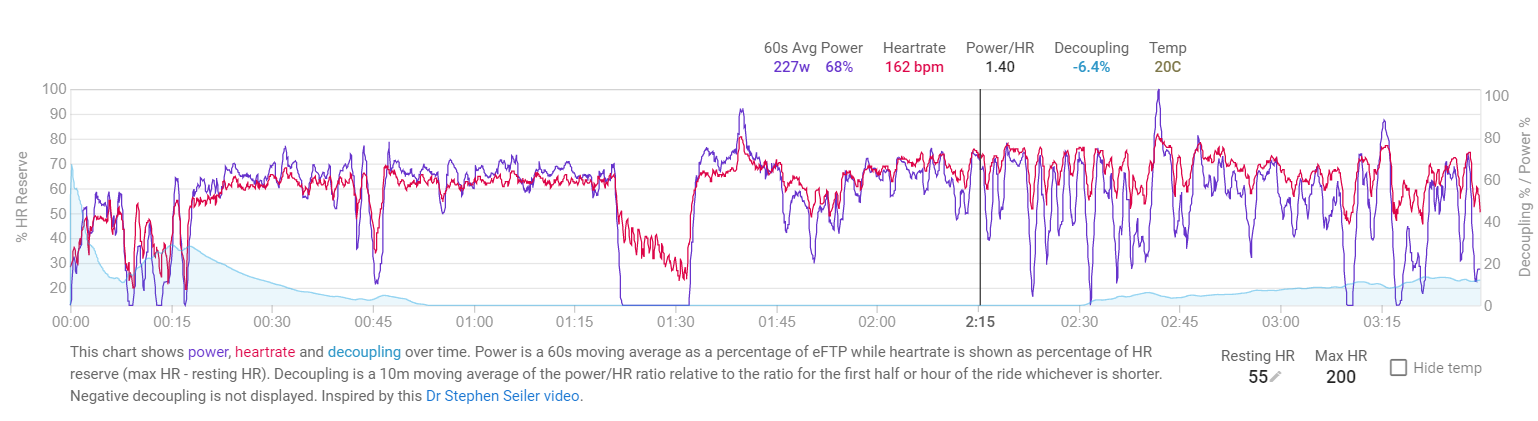
Cyclopaat: on your second screenshot, there is no decoupling. This implies that at that average power, your effort in as measured by HR and your work done [as measured by Pwr] did not change over the course of this ride. That means that the ride did not stress your body beyond what it can currently do.
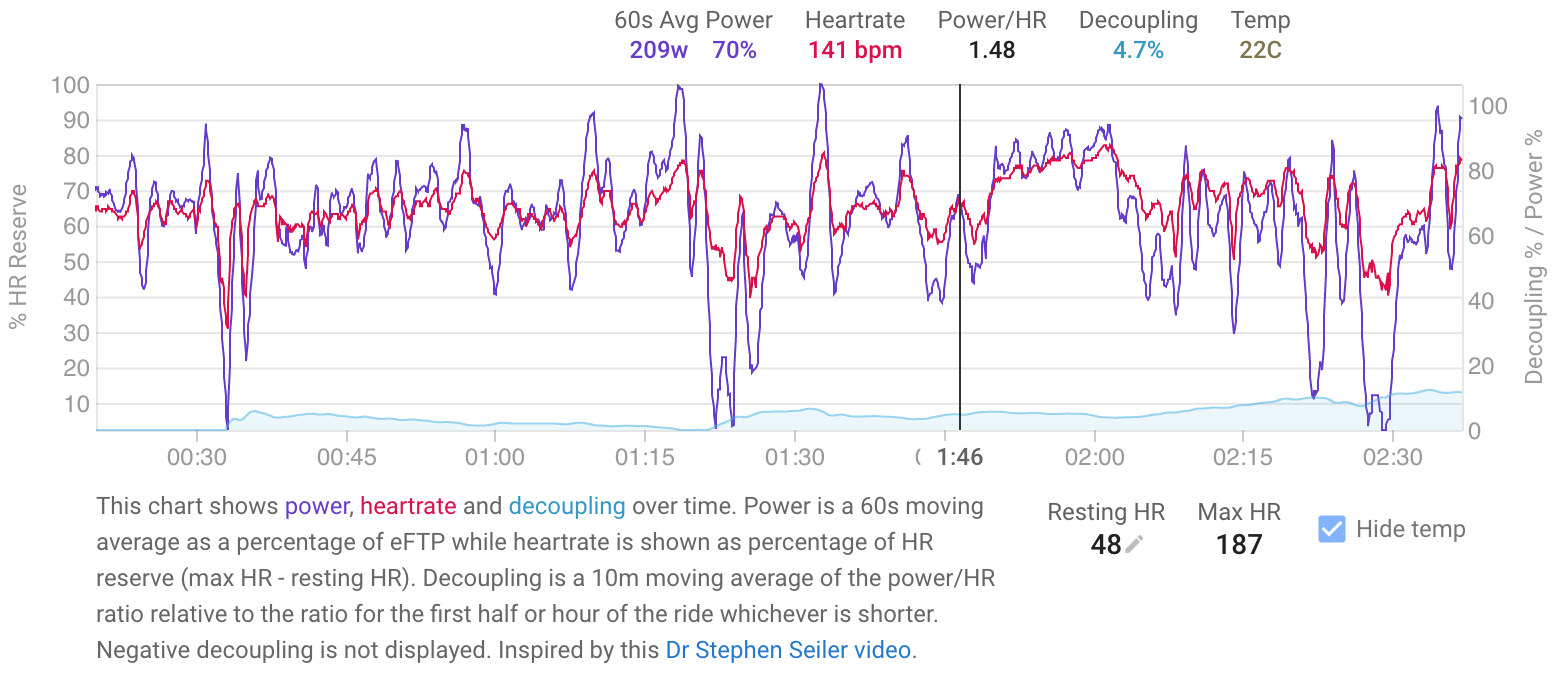
On the first screenshot, there is evidence of decoupling: the blue line at the bottom begins to rise away from the horizontal axis towards the end of the ride. Your were beginning to have to put more effort in [HR rises] to get the same work done. In other words, this workout began to stress your body beyond what it was comfortable with.
In Seiler’s language, if you want to stimulate your body to make new adaptations, you have to provide new stresses and then recover from them. The second workout did not provide a new stress, but the first did. If you want to stimulate new adaptations, then [1] if you ride at the second workout’s power, you need to ride longer; [2] if you ride at the second workout’s duration, then you need to raise power a little; [3] if you ride at the first workout’s power, then this is an appropriate duration.
If the ride(s) are done at about the maximum you can take for that duration, I’ve not stressed it beyond what I can do, but I did near max effort most / all of the time. So, you don’t see decoupling, or does that not make sense? I do wear out sometimes towards the end, because I have a mental problem with head wind - I rather climb a 20K mountain, than ride 20K into a head wind, which usually is a challenge in my pancake flat, wide open backyard. I think that 2nd screenshot is an example of that.
I have a similar issue with normalized power: my NP hardly ever substantially differs from average power, mostly within 5 Watts. Certainly when I ride indoor, but that’s mostly ERG mode, so that would make sense. Outdoors, I can not ride that steady, but overall, the result is the same - the graph only looks more jagged, because I need to corner, or overtake and stop pedaling for a few seconds.
I guess what it means is that I am - like someone else called it – a diesel; I do not sprint, or hardly ever, but I may use bridge to create an interval of 30 seconds or so. Other than that, I just pedal, mostly in Z3/Z4…
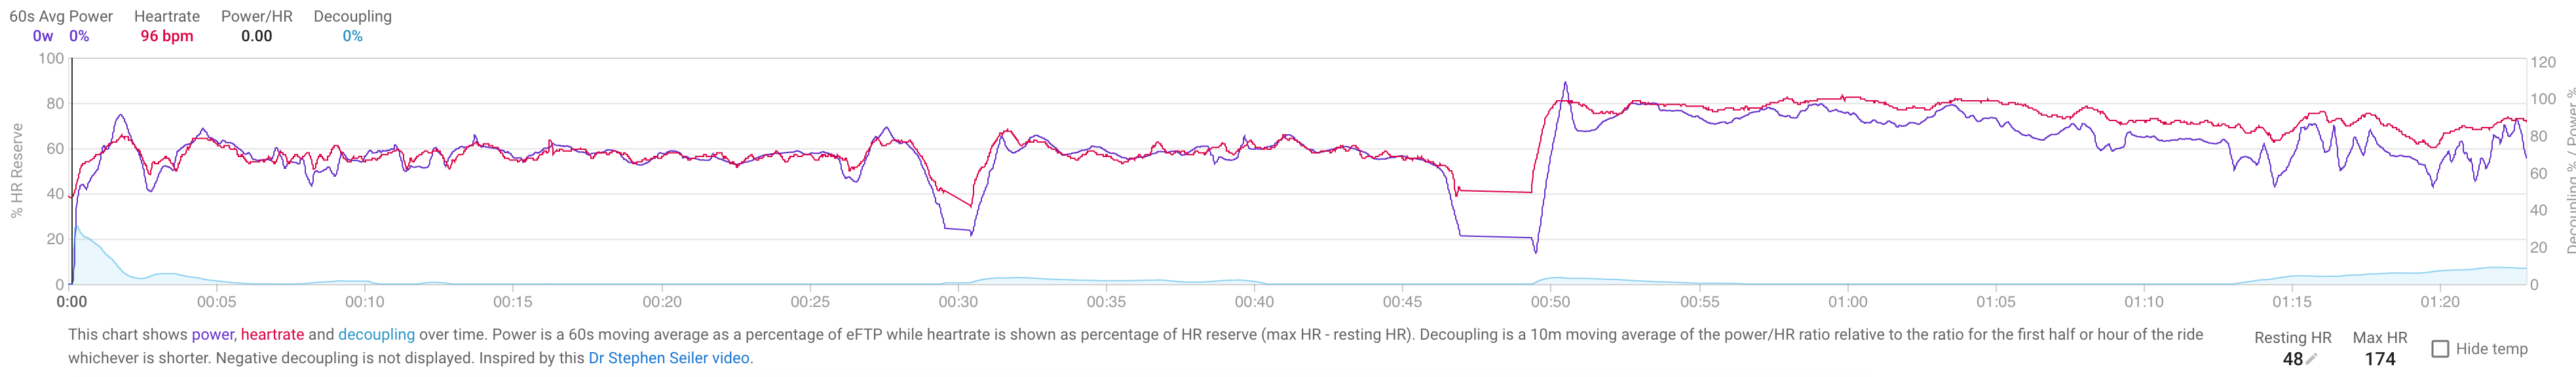
You have zero HR there, seems unlikely! I will fix this tonight. You can use the “Fix Data” button under the ride timeline chart to fill in that drop out if you like.