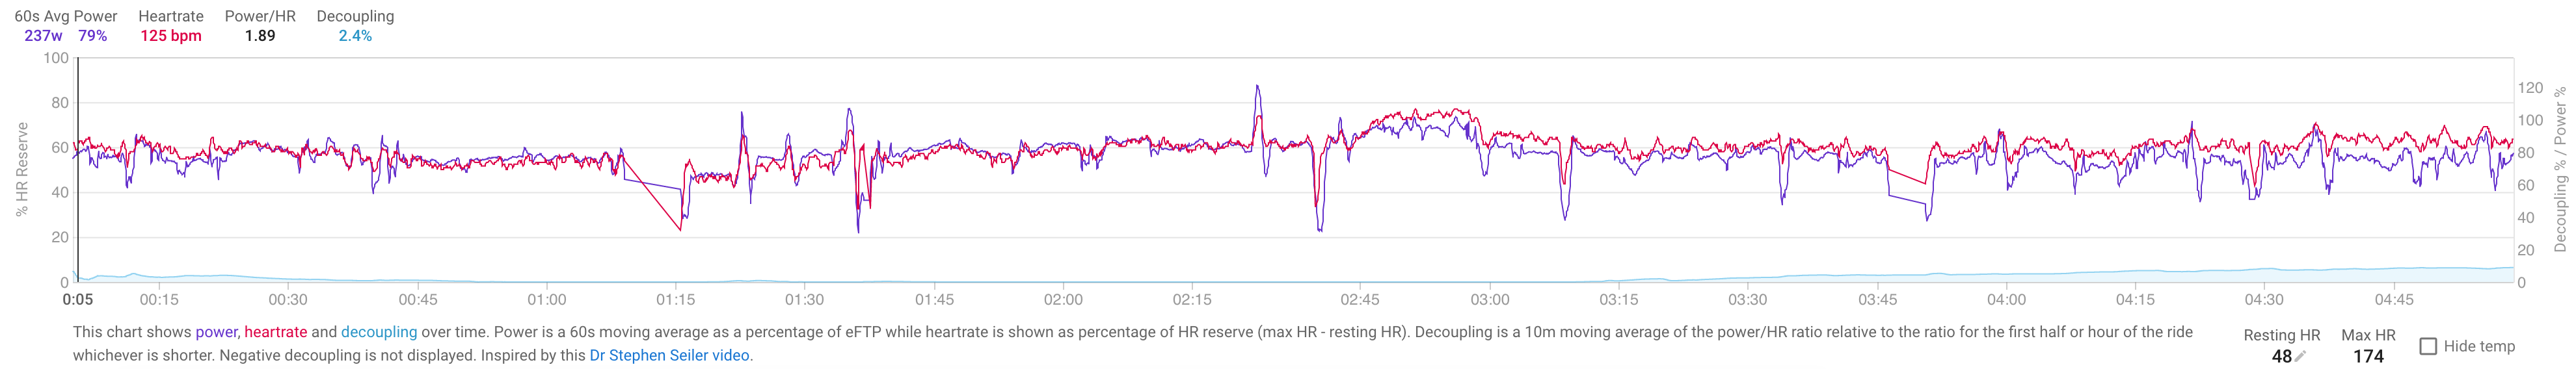
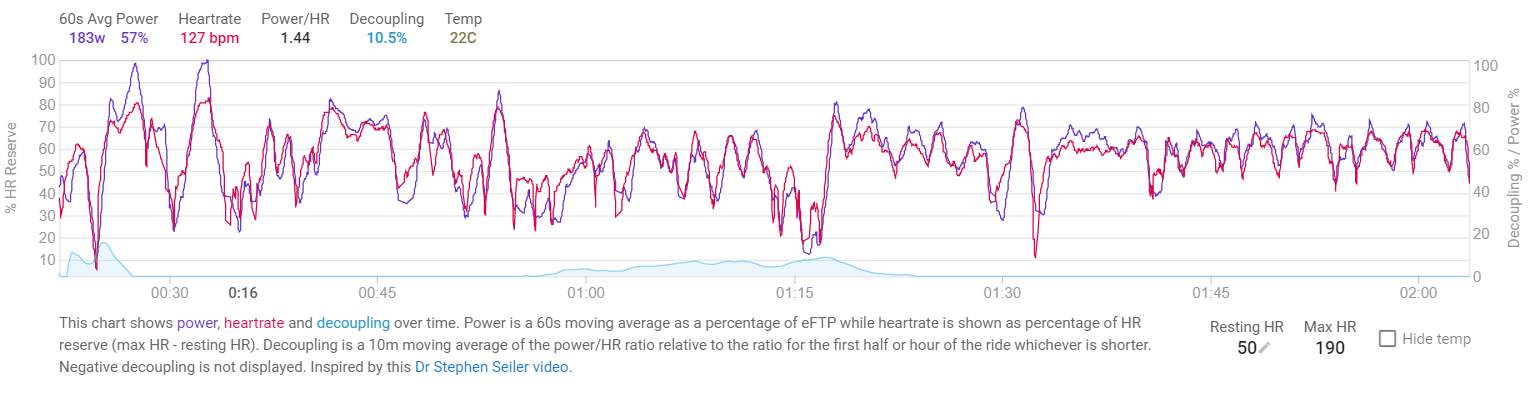
Stephen Sieler on cardiac drift, power/HR and so on

Hi David,

This is my first post so I take this opportunity to congratulate you for all the work done here.

From a physiological point of view, it could be interesting to have the hand on the MAX HR . I guess you currently take it from MAX of season ? MAX of all time ? by discipline ?

Thanks.

Pierre.

Thanks. At the moment I use the max HR for the activity which comes from the HR training zones configured in /settings. You can have different zones for cycling and running (also used for everything else).

Fascinating stuff! Thnks for implementing!
I have one question:
why is there an apparent decoupling right at the start of activities, like for the first half an hour or so, before the line stabilizes at zero? This is counterintuitive as you should be fresh at forst, right? Or does it have something to do with the normalizing?
Also, I think it would be kind of nice to have the 20 minute averages in a table just for the sake of an overview.

Also, Iā€™ve been looking at my longer rides (4h+) and I have found that many of them donā€™t show any decoupling on the new chart, even though I remember very well that the combination of duration and intensity was more than enough to tire me. Any thoughts/interpretations?
This is a ride in which I got extremely tired at the end and it was also hot, yet the chart doesnā€™t show it really.

The HR trace is starting to bump over power towards the end of that ride. So its sort of working. And most of the decoupling shown is in the 2nd half. So it does show, just a bit of subtlety.

I am not sure whats up with that. I used the warmup to exclude that data. I donā€™t think the first 10-20m or so is worth much for this. I am either poking my way through traffic to get out of town or just warming up.

Ok, Iā€™ve looked through many many rides and I think I found the reason: there is almost always some stop/go element in the first 20 minutes or so, which you donā€™t really see in the power, because itā€™s 60s averaged, but it really affects efficiency. I also suspect that if you stop or pause in the first couple of minutes, the data while staying still is being used for the calculation of the base rate and this affects the result too. With the warm-up slider, it can easily be filtered and then the data makes more sense. Important is to exclude any stops and possibly anything that is within 10 minutes from them to clear any dependency of the moving average.

A few observations I wanted to share:

  • on longer descents/coasting, you can see a kind of on the bike resting heart rate below which I donā€™t drop
  • Iā€™ve been pretty amazed at how close together the HR line and power line are in any kinds of rides
  • sometimes there is a small bug wherein the time axis on the chart shows many more labels for a short period of time, see image:
  • sometimes, the decoupling is visible ā€œwith the naked eyeā€, but doesnā€™t appear as a metric. I guess the tuning of parameters can be played around with a bit more.
  • And let me just say how cool it is that a website run by one person is so much in front of massive ones like Strava and incorporates cutting edge ideas almost instantly! Thanks again for that!

Apologies for the long post :smiley:

3 Likes

Cyclopaat, according to Seiler, yes, you have it right: ā€œIf the ride(s) are done at about the maximum you can take for that duration, Iā€™ve not stressed it beyond what I can do, but I did near max effort most / all of the time. So, you donā€™t see decouplingā€¦ā€

Remember, though, that Seiler was really using this method to estimate what combination of duration and intensity induces adaptations. Or, when is an easy ride too easy? His argument is that on rides with steady intensity [endurance], to get an adaptation you need to stress the body beyond what it can currently do. [Then recover. Then repeat.]

The application of Seilerā€™s idea to your case would be: at this power, you can hold it for ~2:45 hrs without significant increases in effort put in / work done. To get ā€œbetterā€ you need to extend those rides at that power out to 3:00 hrs! Of course, you may not want to get ā€œbetterā€ in that sense, in which case the decoupling graphs are simply showing you that you can do this.

3 Likes

Kosio_Varbenov:

Yes! This is something that I have found too. On todayā€™s ride ~2:00 hrs, I got pretty tired despite taking nutrition and 2 bottles with electrolyte. But the decoupling graph [and the calculation above it] both show negative decoupling. In other words, getting tired seems not to be associated with a rise in the %HRR / Pwr ratio. Do others find this?

Kosio_Varbenov, concerning your question

In the first 30 minutes, power is relatively high while HR is only gradually catching up, so Pwr / %HRR is high. In the second 30 minutes, HR has ā€˜caught upā€™, so Pwr / %HRR is moderate. Over 60 minutes [Davidā€™s normalising interval], Pwr / %HRR is the average of moderate and high. Therefore, for the first 30 minutes, the normalised Pwr / %HRR is high [negative decoupling], whereas in the second 30 minutes the normalised Pwr / %HRR is lower [decoupling].

And I agree ā€“ the last quarter of the ride you showed indicates some kind of decoupling, with the HR trace clearly above the Pwr trace.

@Michael_Webber
But if power at the start is high relative to HRR, then we should be seeing negative decoupling at the start, right? As per definition, the average decoupling for the first hour or the first half of the ride should be zero (as thatā€™s what you do when normalizing in the reference frame). Yet consistently, I see such a behaviour:
2
You can see power and HRR aligning well, but still, massive decoupling of up to 40% appears.
Until this initial decoupling goes away, up to 40 minutes pass. To neutralize this, thus, I need to ditch a large chunk of rides, which doesnā€™t seem nice to me. Puzzling stuff.

I can see your problem, though this is different from the first ride that you posted.

One thing to note: for the first hour, average decoupling is zero. But David does not show negative decoupling. So the graph always looks as if there is decoupling or zero decoupling.

Actually, I donā€™t get this ā€œnegative decouplingā€ business at all. In the Seiler formulation the index of decoupling is a ratio of two positive numbers, both normed to equal 1.0 for the second 20 minute period of a ride [or, in Davidā€™s case, the first 60 minutes of a long ride]. Thus the index fluctuates about 1.0, rising if there is decoupling, and falling if power is rising relative to HR. But it can never be negative, by Seilerā€™s definition, so I am not sure how David has implemented this idea.

I have an implementation of Seilerā€™s calculation on a spreadsheet. If you let me follow you then I could download the csv file from the intervals data tab in activities, and compare my calculations with Davidā€™s and see where the discrepancy come from. Iā€™ll submit a request to follow you.

Iā€™m glad I sorta got it right :sunglasses: This is just my thing: go long, go hard and I can extend it alright, but closing in on 4 hours, thereā€™s a little more decoupling going on.

These were just over a century and 4 days apart - I did only two shorter rides in between :joy:


1 Like

Ok, so here is a recent ride. Iā€™m going to use it to indicate a couple of issues that I have encountered using the Seiler method. The graph is computed using Seilerā€™s methods, as outlined in video that David posted 6 days ago:

.

The blue line represents the HR/Pwr curve for 20 minute intervals. Note how it is high at the beginning of the ride and again in the middle. That apparently indicates decoupling [HR high relative to Pwr]. How can this be? Itā€™s not that the Pwr was especially high during those periods.

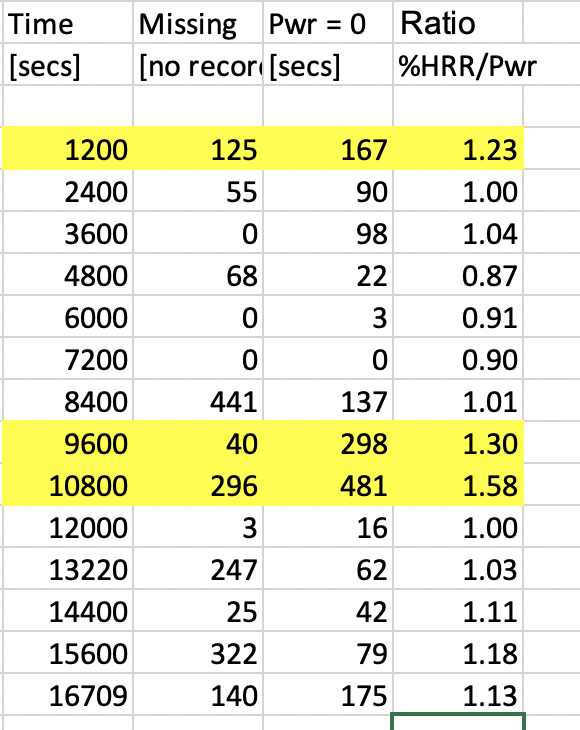
I downloaded the ride csv file [thank you David!]. And here is what I found, again for the 20-minute intervals:


On this table, the columns are, from left to right: the time at the end of the intervals in seconds; the number of seconds for which there was no record [headunit not recording] during that interval; the number of seconds for which Pwr = 0 in that interval; and Seilers HR/Pwr ratio [the blue line in the chart].

At the beginning of the ride there are 2:05 mins with headunit not recording and 2:47 mins with Pwr = 0. This is a period of start - stop riding - coasting up to stop signs, coasting up to red lights, stopping and then starting again. You stop pedalling and when you stop motion the headunit turns off after a few seconds. Between the time when you stop pedalling and the headunit turns off, Pwr = 0, but HR is still being recorded. So HR/Pwr is high: you are apparently decoupled.

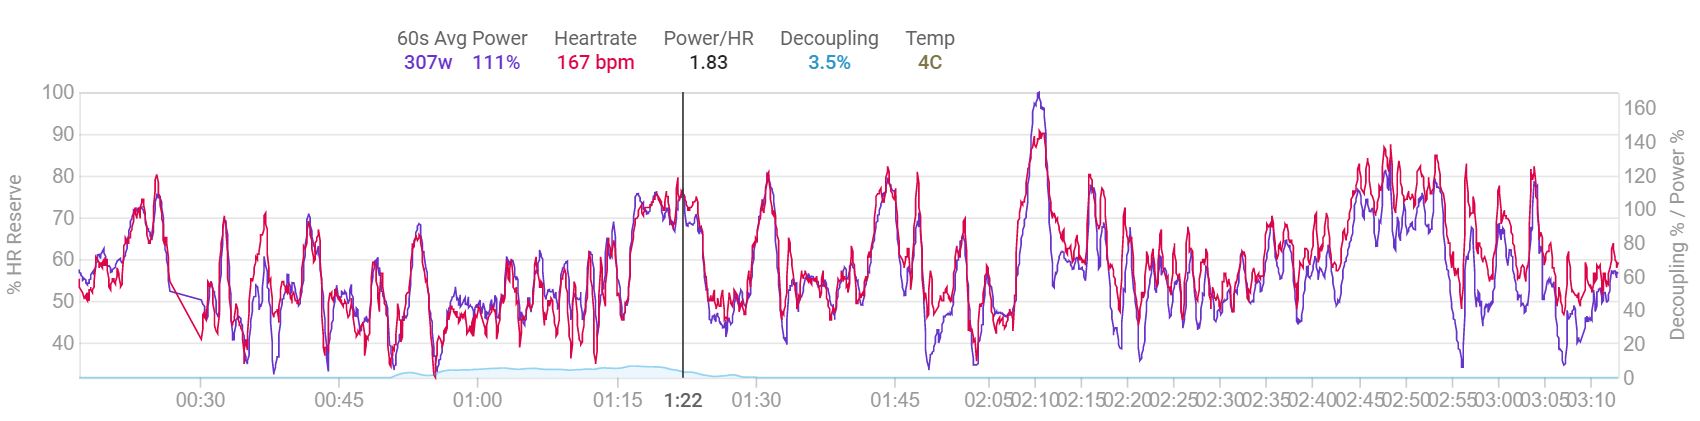
After 45 minutes or so [2700 secs], the ride settled into a mountain climb, which took until 2:10 hrs [7800 secs], when power was steady and the decoupling index stabilised at about 0.9.

At the top of the mountain, took a break, descended the mountain with periods of coasting, took some more breaks. This phase last until nearly 3:00 hrs into the ride [~10500 secs]. Notice the periods of no record from the headunit [= breaks] and of zero power [= coasting]. Again, while there is zero power but movement, the unit is still recording HR. Again, apparent decoupling.

The a steady ride home, except for a break at about 4:15 hrs [~15300 secs], which again shows up as decoupling.

So: beware, oh take care! Stops, coasting and the like make more complex the interpretation of graphs of decoupling.

Another phenomenon which affects the apparent level of decoupling is changes in cadence. Seiler notes this. And I can confirm his observations.

All that said, what does this graph indicate? At 200 minutes, the blue line [Seilerā€™s index] is at the same level as it was at 140 minutes [though both observations are affected by stops]. After that, though, there is some evidence of real decoupling: the blue line begins to rise steadily.

Sorry for the long post. I hope that this helps everyone interpret these data.

1 Like

Kosio_Varbenov: OK, so I have examined your ride of 25 April. As I explained in my previous general post, the calculations have a problem when there are periods of zero power but a heartbeat record [ie, coasting]. If I take the zero powers out of your ride file, then the bump in the decoupling trace between 2:40 hrs and 3:40 hrs disappears; the high values at the beginning [0 - 45 minutes] are diminished, but remain.

What is going on at the beginning, I think, is this. First, there are lots of times when your power is low [up to about 18 minutes in], but this is sufficient to raise your HR. You can see that your HR trace is consistently above the Pwr trace. Then you start to raise power, but with breaks [up to about 1:05 hrs in]. You can see that your HR response is well below your power trace. You can see this pattern continuing until about 2:45 hrs. In other words, at higher Pwr, your HR does not respond too much. That suggests ā€“ if Seilerā€™s normalisations are correct ā€“ that either your HRmx or your HRrest are not set correctly.

Then, after about 2:30 hrs, there seems to be real decoupling.

1 Like

@Michael_Webber thanks for your informative post and also for checking out my data! So it seems that coasting (or a power of 0 for whatever reason) is a real issue because it cannot be completely outruled even if you are trying to ride steadyly outdoors. I think therefore that it might be an interesting avenue of ā€œresearchā€ to filter the data and cut off the following:

  • all data points with 0 power
  • potentially all data points with very low wattage (say below 50) because they will never allow HR to fall accordingly, from my experience
  • potentially all data points immediately following the two mentioned above, say up to a minute afterwards.

I can immediately see that this will cause very a ugly discontinuity in the graph and chop it to bits, but still I think itā€™s worth experimenting with because it might reflect real decoupling a bit more accurately :slight_smile:

PS. Would you be willing to send me the excel file with my data? Also, thanks for pointing out the heart rate settings. My max HR is dialed in quite precisely, so maybe itā€™s the resting one which I should reconsider. However, playing around with it now, entering values between 30 and 60 doesnā€™t change all too much, the trends remain the same. I set the value as a kind of average during-the-day value, so I guess I should lower it to first thing in the morning, lower value (which does occcur, but I thought might be misleading to the algorithm).

Can I get a little help with these filesā€¦

If my HRM is 190bpm 70% of that is 133bpm. I should stay under that keep my easy rides easy and under LT1, right?
When decoupling is minus does that mean you should increase the watts?
Iā€™m still confused at what my HR should be at in these endurance rides. For me to keep it under 133bpm (LT1) I have to keep it under 195w otherwise my HR rises to highā€¦

Hi Michael,

I give up! How did you generate the data in your table? And how did you derive the Ave HR and Ave Pwr for the 20 minute segments?

When I tried to download the intervals.icu data for my latest LIT ride I got a spreadsheet with 9000 rows (1 per second). I canā€™t see how to avoid tedious busy work firstly identifying the segments then averaging the HR and Pwr in each segment. I do concede Iā€™m no Excel wizard.though!

Ray: I cheated! I use TrainerRoad, on which you can define intervals of whatever length, and it provides summaries for you.

I have just done all that work for Kosio. It is a bit tedious, but then I never considered that I was going to be in demand! There would need to be a lot of work to make this process applicable to any ride ā€“ for example, different rides have different periods of missing data [headunit paused or stopped recording], the rides are of different lengths and so on.

Then you have to decide what you are going to do about Pwr = 0 or Pwr very low [eg coasting to a stop or gently pedalling while going downhill]. These make a real difference to the results.

Sorry about that.

Kosio_Varbenov: that is a good idea.
And yes, on reflection, the HR settings and the power setting do not affect the trends ā€“ they are there for Seiler to be able to compare individuals or for you to compare yourself over time.

To everyone else: if you are going to get results that are meaningful and that you can interpret, then my experience is that all data points with Pwr = 0 should be dropped from the analysis. And, as Kosio suggested, all data points where you are just pedalling gently [eg going downhill] also need to be dropped.