I train at widely varying altitudes and am interested in finding ways to compare my efforts at different elevations in a standardized way. I know there are charts that predict power loss as elevation increases. It would be cool to have a chart built that automatically translates power output to what it would have been at sea level (or some other standard).
Thank you! I did not know this–appreciate you showing.
The follow-up I have is that I live at 2,500 meters and so I’m interested in being able to track my acclimated altitude-adjusted power bests, on the best efforts power tab, so I can more accurately compare my best performances, whether they are at 4000m or 0m altitude.
For instance, my current season 20 minute best power was set at a much lower elevation, and my numbers at home are lower than that, even though I believe I’m more fit. I’m trying to smooth those differences in tracking performance over time, instead of just at the activity level.
Hmm. You can’t do that yet but if I add average altitude or min or max altitude to the activity stats it would be possible to filter for “altitude at least xxx meters” or similar on the /power page. That would probably work?
Yeah that would be great. Another (harder) option could be an option to select the data source for the power tab of acclimated power instead of raw power or whatever is driving it now. Thank you!
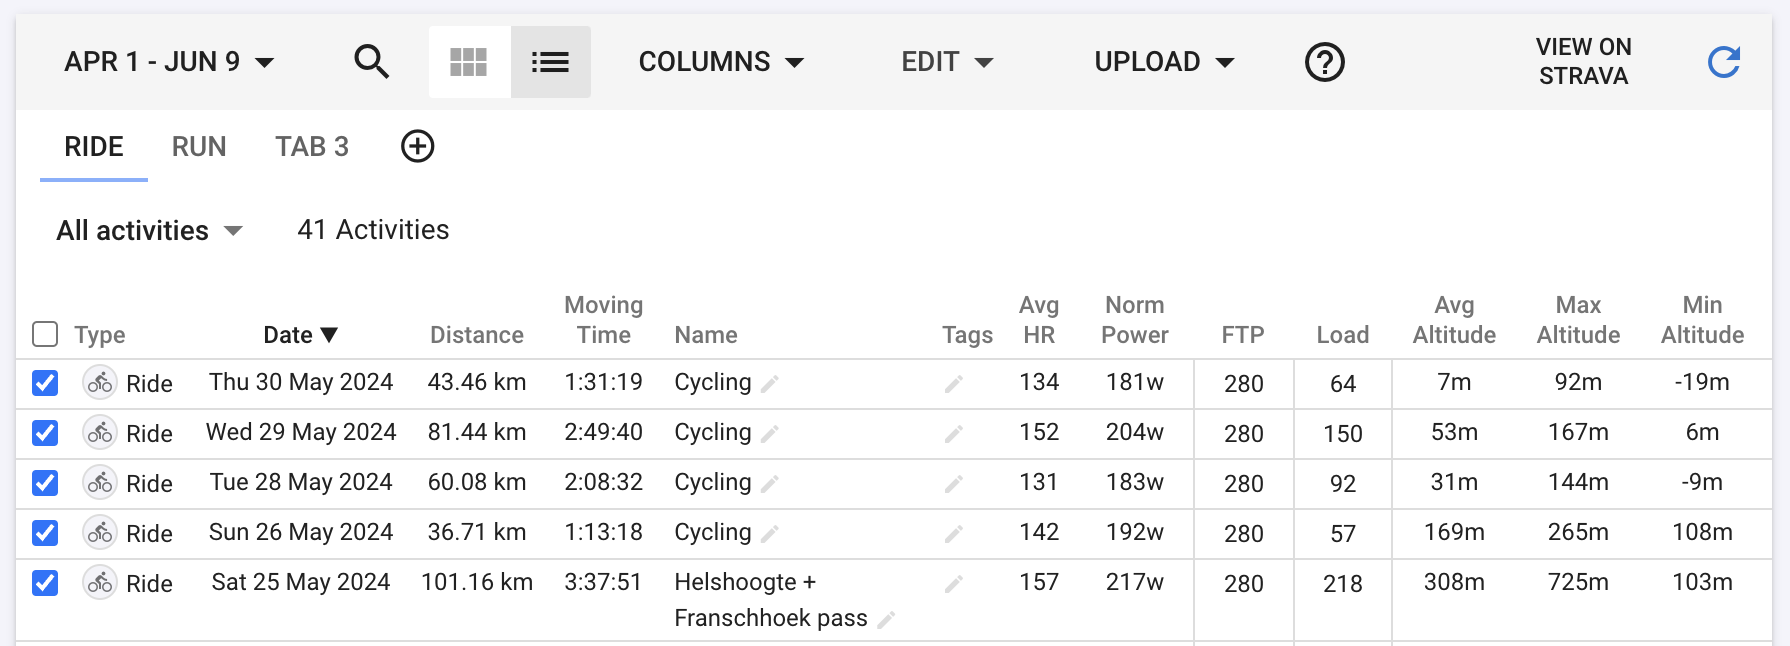
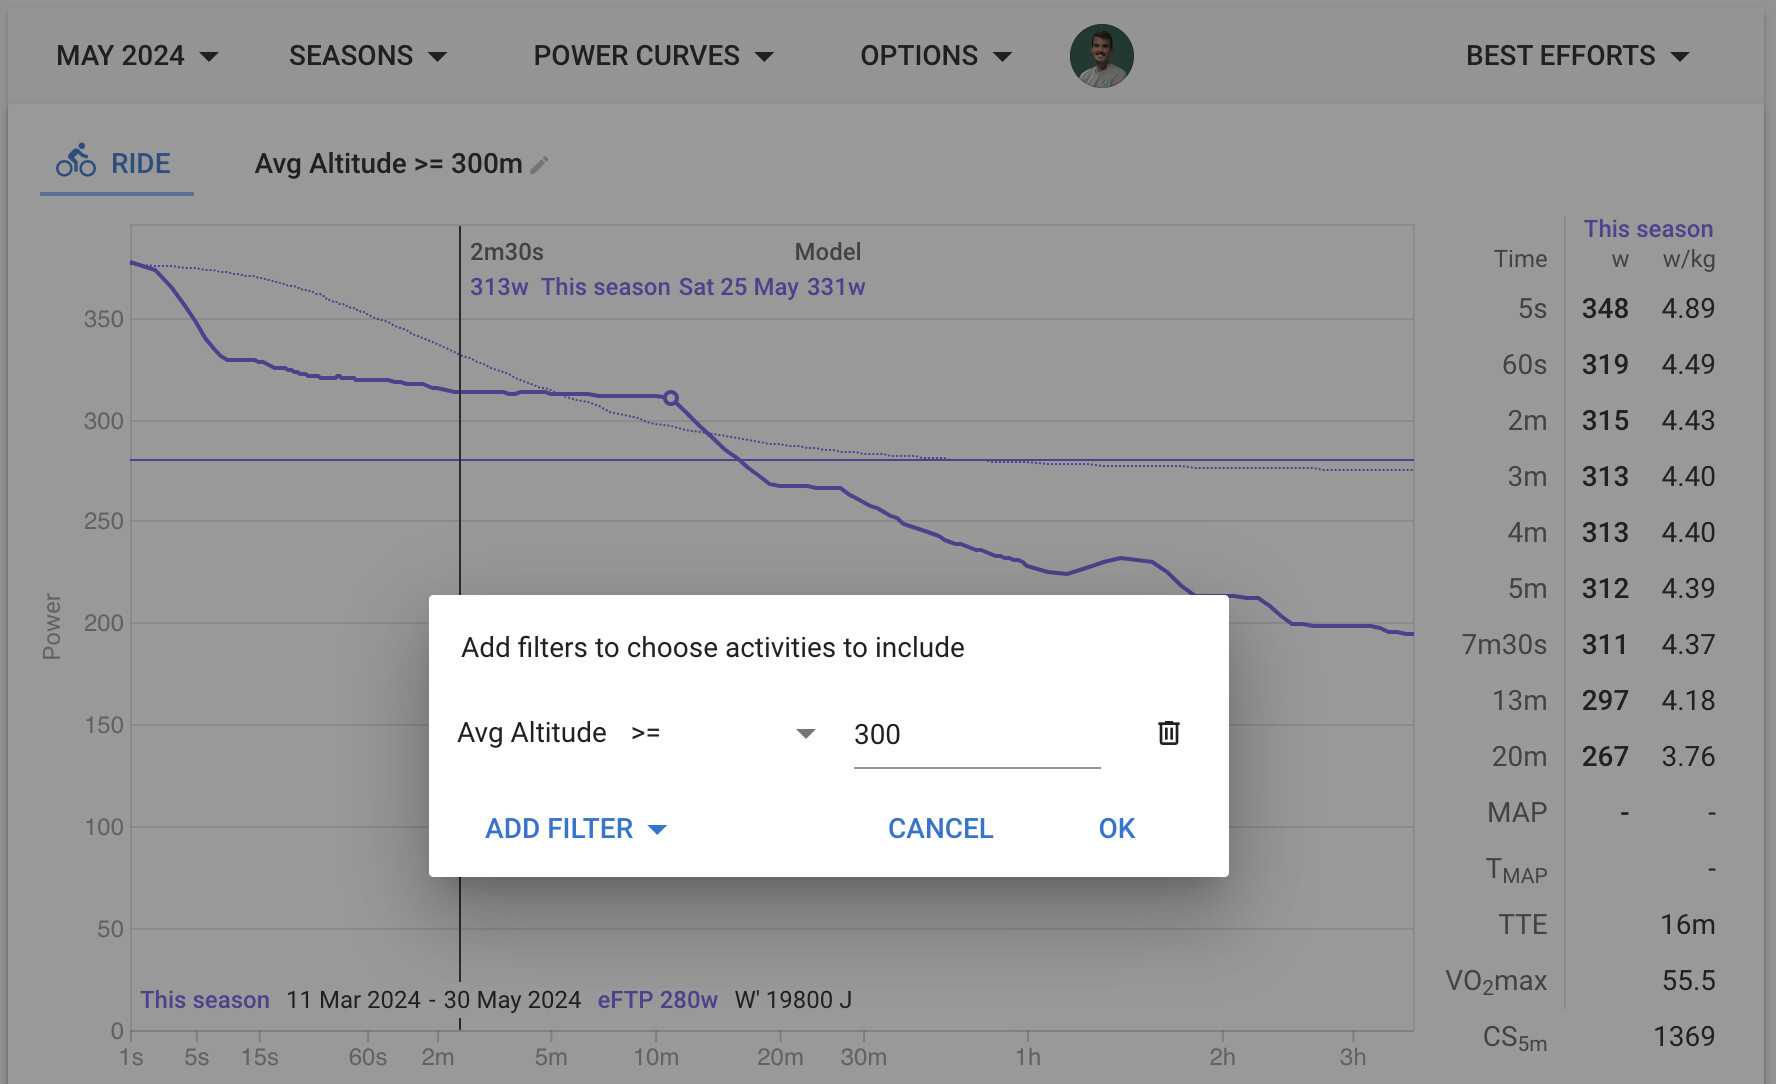
The altitude adjusted power is calculated on the fly for the chart so can’t use that for this. I have added average altitude, min altitude and max altitude to activity. You can see these on the list view and filter there and on the /power page etc..
I have started a job to compute this for everyone but it will take a very long time. If you want to use this on old activities you need to re-analyse them on the activity list page.
Interesting! I continue to appreciate the interest here, I know even among my most committed cyclist athletes the topic of altitude adjustment is a pretty niche thing. Who lives at 2500m altitude, right !? That’s extreme but there just aren’t that many at altitudes where it matters at all, 2500m or not. So thanks.
Sounds like what I need to do is maybe make two charts when I’m looking for iso-altitude-effect fitness trends? One that includes “altitudes where there is no performance decrement”, and one that is “home” (2500m) ? And use the filters to include or exclude activities based on that, with the data input being “fixed” by me with per-activity altitude adjustments for virtual rides?
I think I’ve got that right but thought I’d ask. Cheers