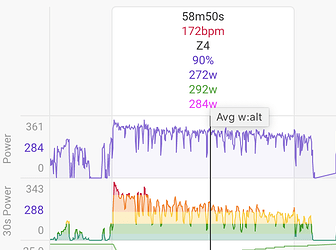
Intervals.icu can now plot power adjusted for altitude (tx @John_Peters_endura.f ) using the unacclimatised (1-7 days at altitude) and acclimatised (several weeks at altitude) formula from Bassett et al. Here I have plotted power & power adjusted for altitude (acclimatised and not) on Alpe D’Huez. I didn’t pace it quite as badly as I thought!
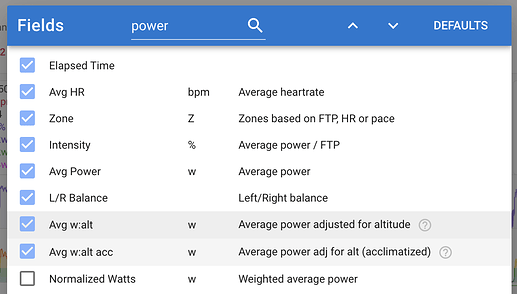
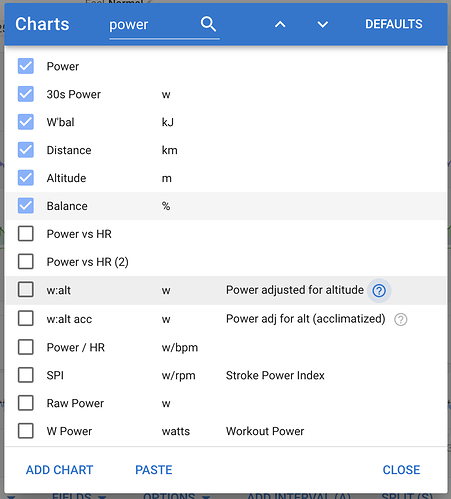
Click “Charts” to add these:
If you want to see all 3 together click Charts → Paste and copy in this code for the custom chart:
{
  "id": "ccc0d26339",
  "name": "Alt Adjusted Power",
  "height": 120,
  "yAxisLabel": null,
  "yAxisMin": null,
  "yAxisMax": null,
  "y2AxisLabel": null,
  "y2AxisMin": null,
  "y2AxisMax": null,
  "plots": [
    {
      "id": 1,
      "text": "Power",
      "color": "#6633cc",
      "extras": [],
      "legend": false,
      "stream": "watts",
      "transform": "avg_60s",
      "areaOpacity": 0.05,
      "lineOpacity": 0.7
    },
    {
      "stream": "watts_alt_acc",
      "color": "#ff00ff",
      "text": "w:alt acc",
      "areaOpacity": 0,
      "lineOpacity": 0.7,
      "legend": true,
      "transform": "avg_60s",
      "id": 2,
      "extras": []
    },
    {
      "stream": "watts_alt",
      "color": "#24a122",
      "text": "w:alt",
      "areaOpacity": 0,
      "lineOpacity": 0.7,
      "legend": true,
      "transform": "avg_60s",
      "id": 3,
      "extras": []
    }
  ],
  "legendPos": "topLeft"
}
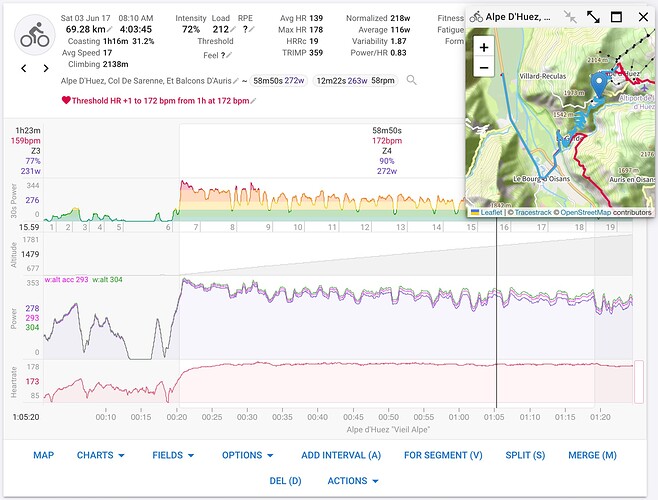

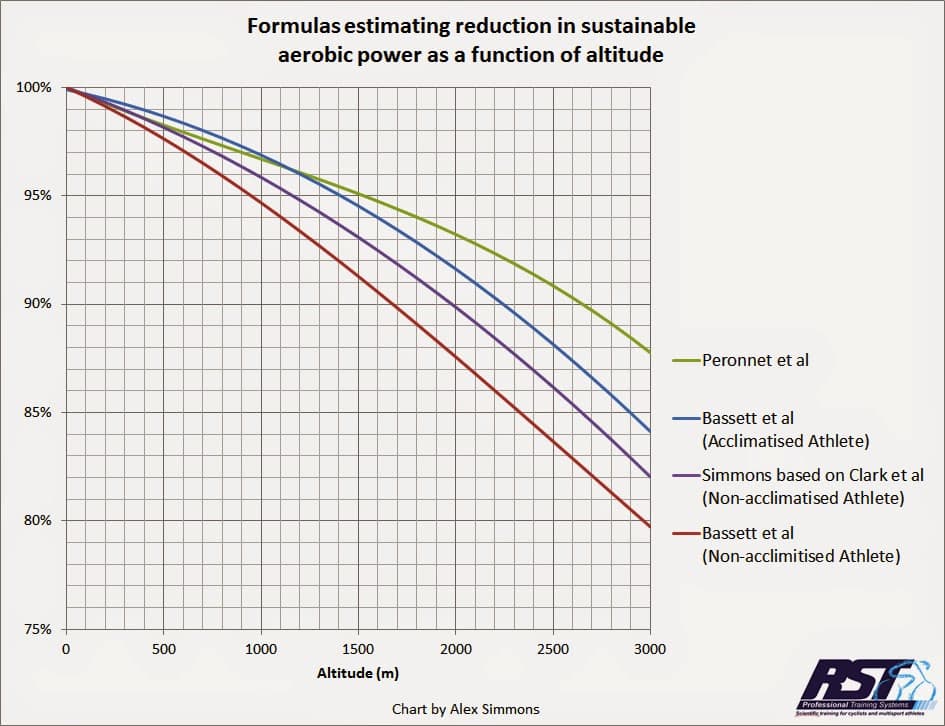
 Quick question though - shouldn’t the acclimatized estimate be higher than the un-acclimatized estimate? Looking at this, it would indicate so: