Hi, I’m new here, so I hope I’m just missing something simple. I would like to view separate ‘Fitness’ charts for bike activities vs. run activities. Right now they are lumped together into one ‘Load’ value, which isn’t that helpful for the way I’d like to assess my training. Is there a way to build a Fitness chart for each sport? Thanks very much, this is a fantastic tool, and amazing that it’s offered for free!
Click the options dropdown on the fitness page. There is a box for run and ride both.
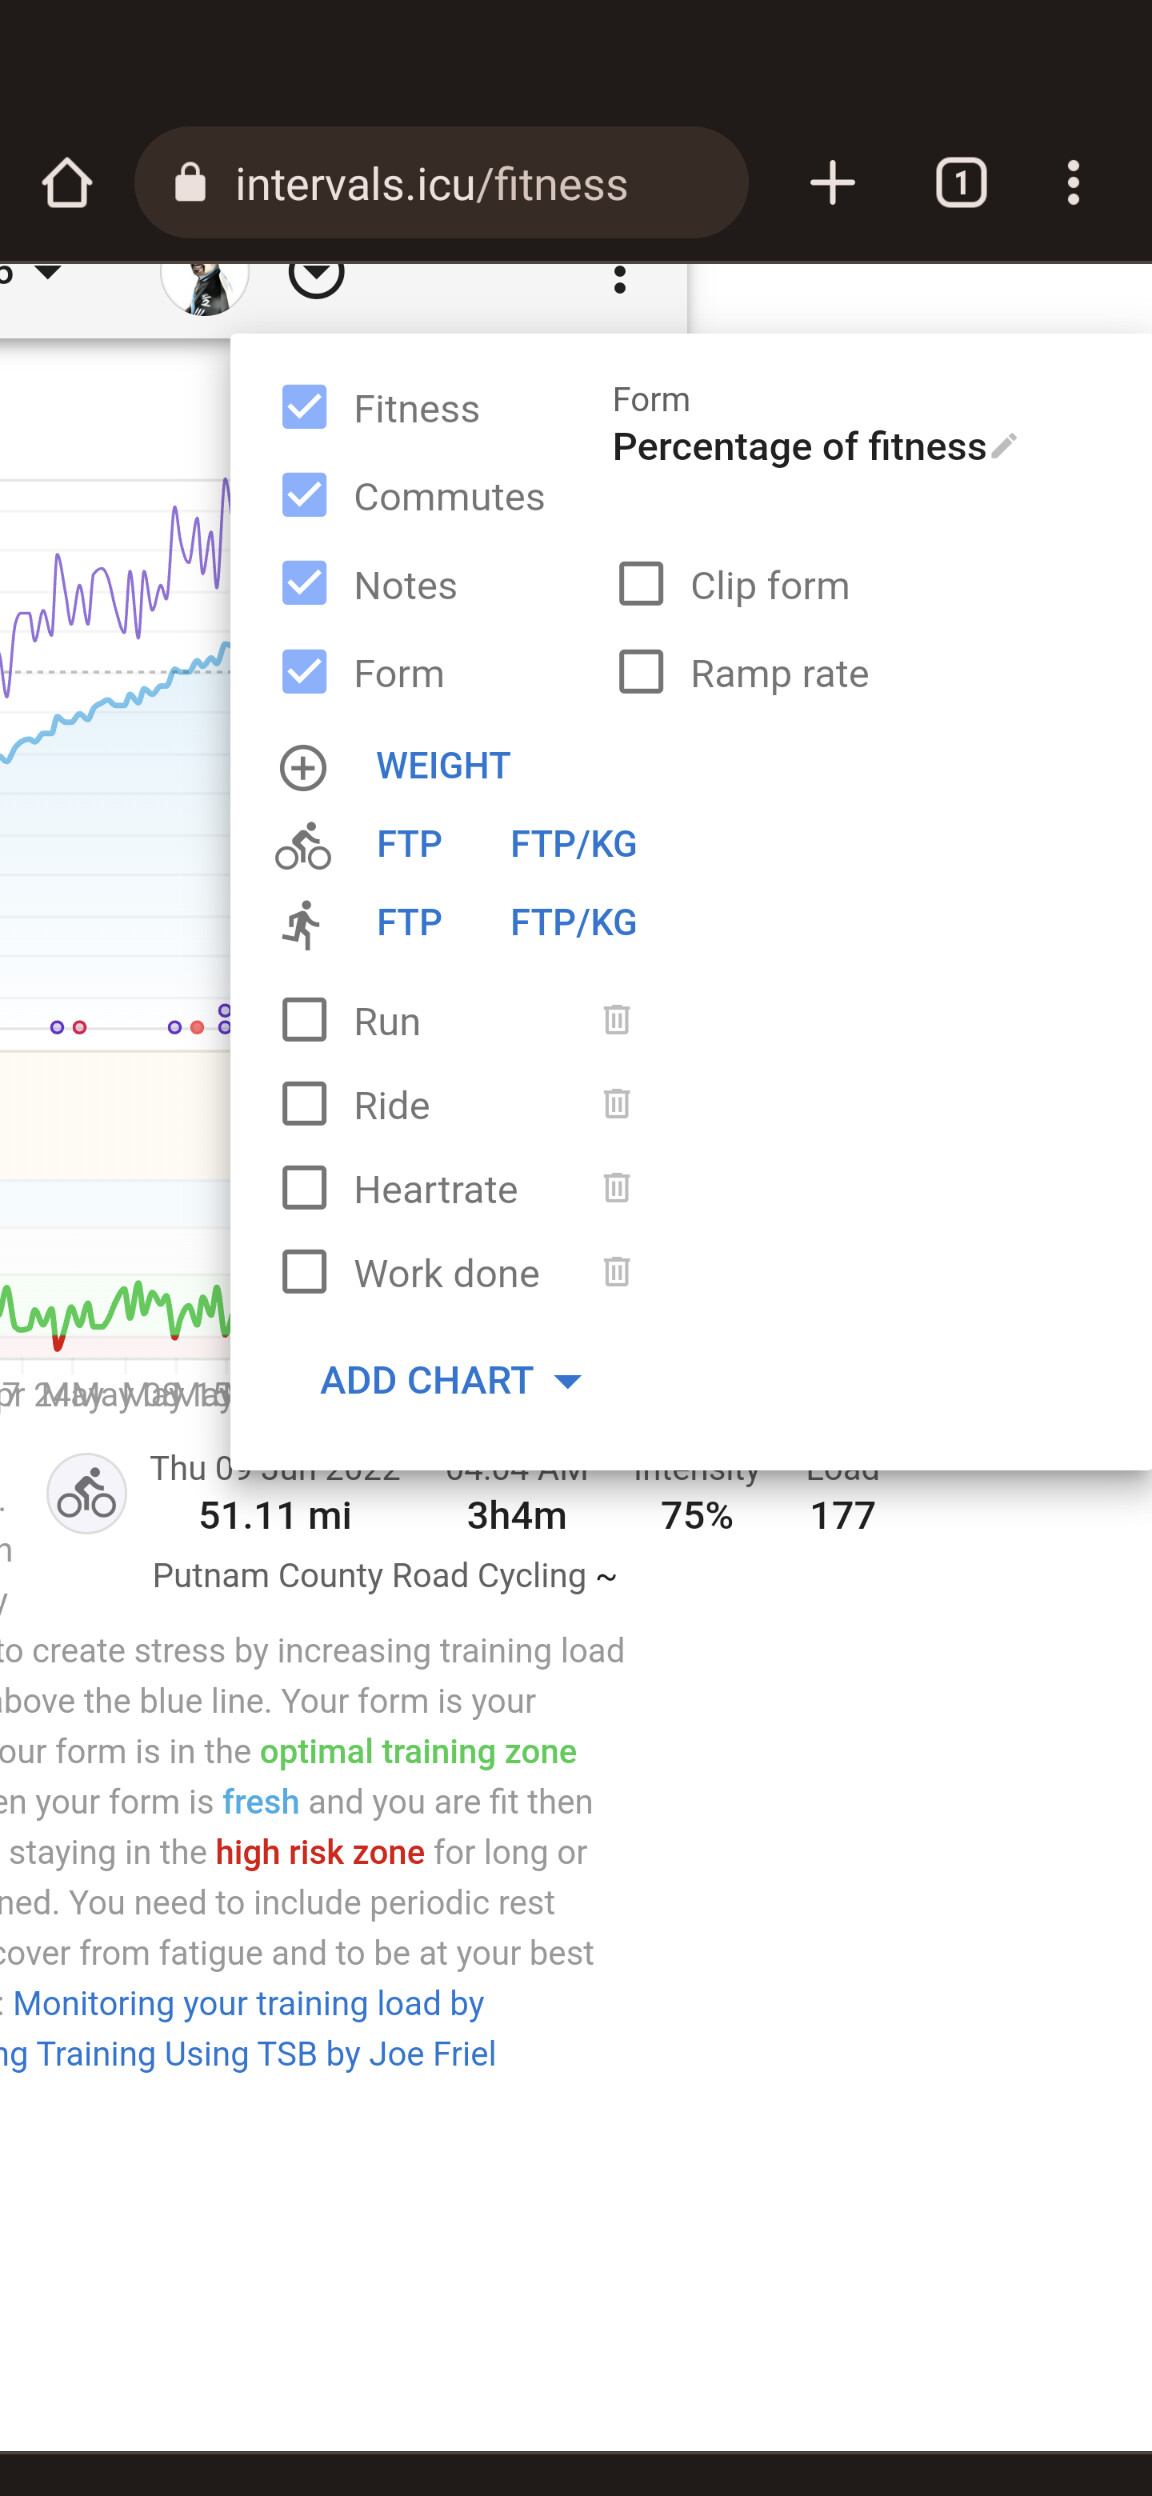
Hmm.. Am I overlooking something?
I’ve never seen any way to split up Run/Ride for fitness.
Can you post a screenshot?
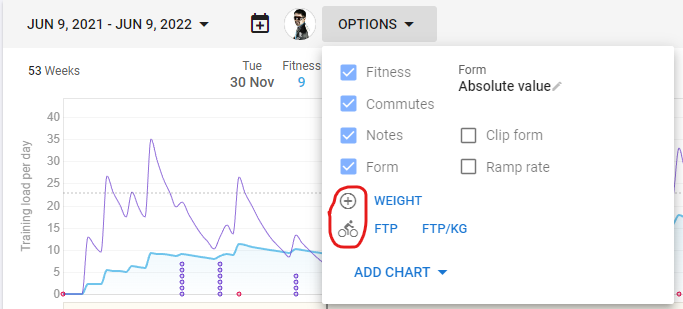
This is what I see. The ‘plus’ and ‘bike’ icons look like they might work, but they are just icons, not buttons.
I don’t actually think this is possible. I did wonder if you could create a custom chart on the Fitness page, select fitness and then filter ‘all activities’ to just show run/ ride. That way you would have a combined fitness chart and discipline specific ones also, but unfortunately the filtering option is not available…
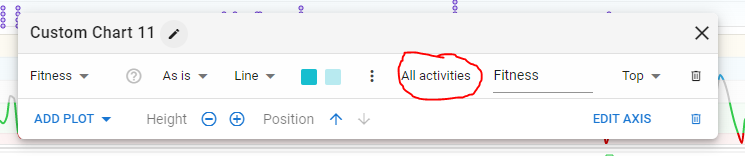
As @Olly_Thomas suggests you can create a custom chart with a filter:
2 Likes
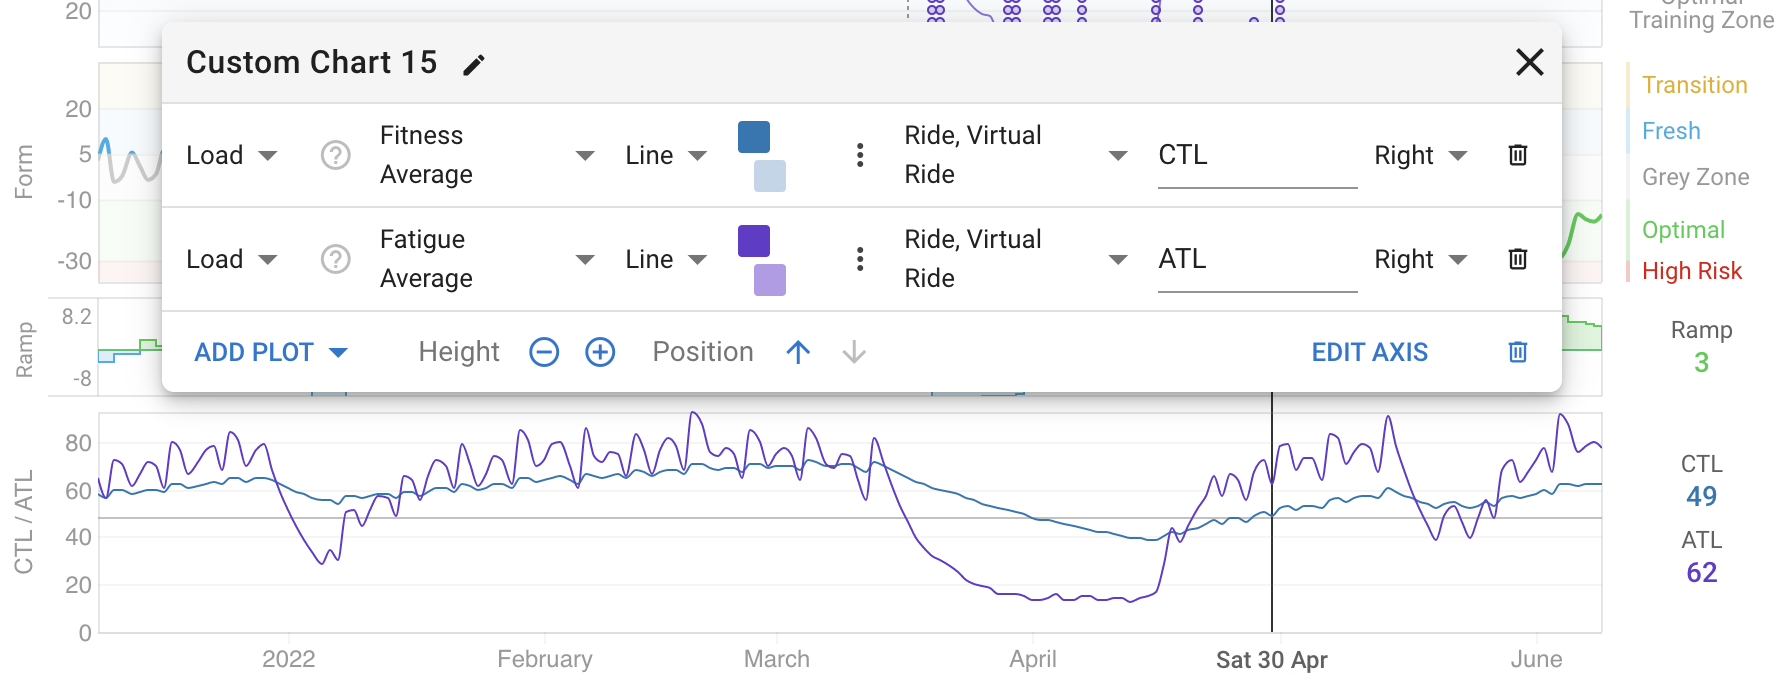
Ahh of course, I was using “Fitness” as the data point  when of course it is “Load” you want
This must be how @PleasantRidge has them on the screenshot posted as they are not “out the box” charts
1 Like
Splitting up the fitness for different sports has been discussed in the first editions of the Triathlon Training Bible by Joe Friel. But I think that most triathletes now use a single fitness chart because the fitness chart is supposed to give you an idea about your cardiovascular fitness which is an omni-sport metric. I don’t mean that separating the different sports is wrong, it’s just a different way of looking at it. If you know what you’re doing, it can be valuable to look at the balance of the different sports. Still I’m convinced that the overall fitness chart is most valuable to determine your actual state of fitness.
1 Like
Thanks to all for the help! Filtering on custom charts should give me what I need.
@MedTechCD, I agree with you, it’s a different way to look at the data. I just don’t like the fact that when combined, I don’t know if my fitness is 100% from cycling, 100% from running, or somewhere in between.
But this solution is perfect–I can look at all three charts in one view.
I think the model is trying to show the mathematical effect of training on athletic performance, going along the lines of what Bannister and Morton originated in the 80’s/90’s. There must be a validation to the curves, i.e some correlation to a real world facet of performance.
For example, if the charts say your running fitness is skyrocketing, in theory , your mile times should also improve, assuming you are doing endurance training. We know that’s not always the case. Today you could be healthy, tomorrow you could be limping due to a soft-tissue injury.
Multisport is one of those areas were you can’t put all the eggs into any one basket , and often athletes put more time into the swimming or the biking for obvious reasons. To suggest that your running performance should be rising due to putting time in the biking or swimming basket would be a stretch. So there is still a case for the OP’s question.
2 Likes
Hi David,
Thanks for this. I’ve tried creating the chart as suggested but am getting a slight difference when I total the individual swim/bike/run fitness components vs the total fitness number I see from the generic fitness chart. Any idea what the reason for this could be? (Aside from quite possibly my own ineptitude!  )
)
The CTL line uses an exponential moving average so even training done long ago has a small impact. The all activities numbers are calculated from your complete training history. When you use “Fitness average” it starts 84 days before the first date on the chart, not right from the beginning of your history for performance reasons. So it might be a little different. There could also be rounding differences and so on.
Hi, My FTP for running and cycling are pretty different and it’s distracting me how the eFTP and eW/Kg are plotted as a sawtooth between the activities per day. Sorry to put this on a really old thread, but I was hoping that now with 2 tabs I could do this better, but I haven’t found a way as a chart added to one tab will share the filters on the other tab. I’d just like to filter the whole page by activity types per tab please.