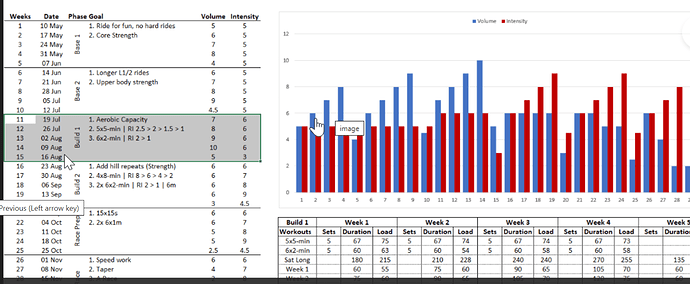
I have just uploaded a 1.6 version of the API_TOOLS excel file which has a formula for the week numbers (ISO format) and respects the format needed for the ATP plan (yyyy-ww).
It’s available at the same link.
I’ve responded privately with YvesTri, but for general information to others, here is a general overview of the plan:
The plan is only a template, and needs to be created by you, based on your requirements.
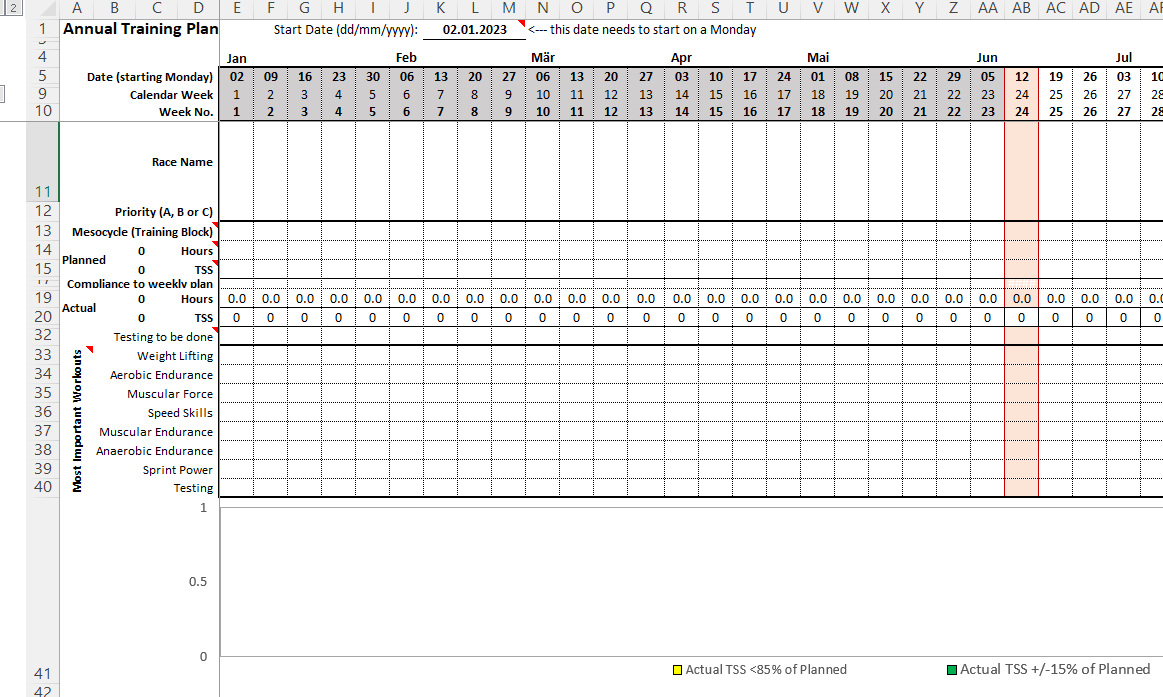
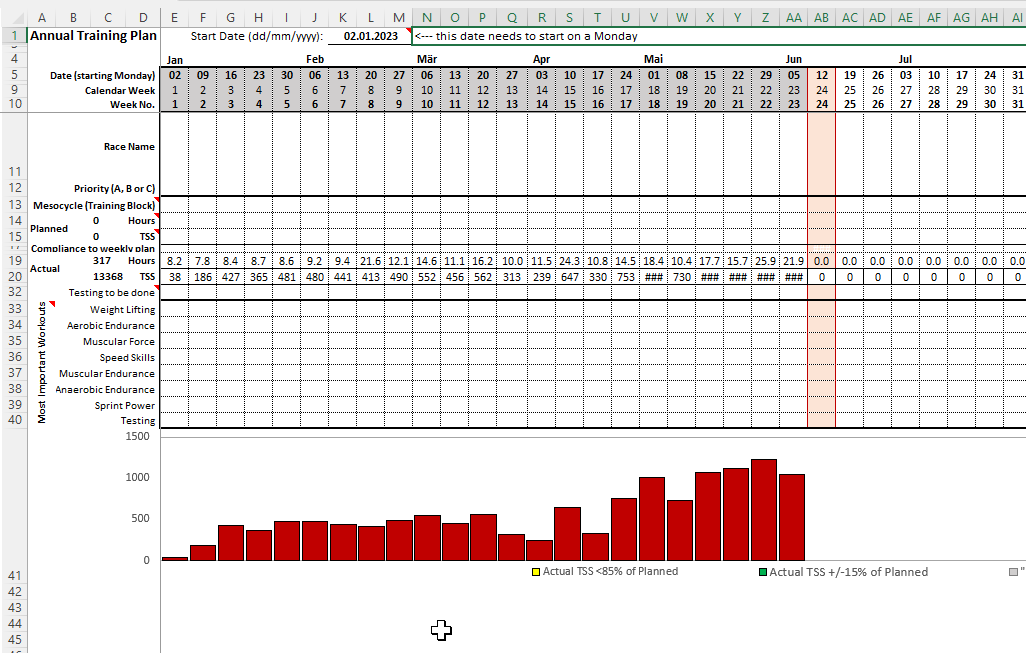
- Insert the start date in cell K1;
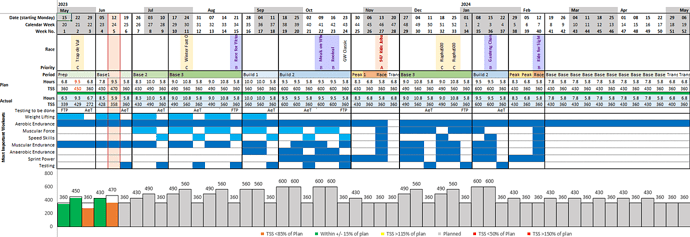
- It has now created a year plan for the next 52 weeks (rows 9 & 10 show the calendar week and plan week; which can be different depending on the start date of the plan.
- Row 13 is the mesocycle week, eg. base1, base2, build1, taper & race, etc.
- Rows 14-15 are the sum of the planned weekly hours/load.
- Rows 19-20 are the sum of the actual weekly hours/load, that you would get from the activities tab.
- Row 16-17-18 are showing if you are compliant to the plan, eg. <50% (red), 50-85% (yellow), 85-115% (green) or 115-150% (yellow) or >150% (red).
- Rows 32-40 shows the testing and areas to target. 1 = primary goal, 2 = secondary goal
- the graph in row 41 will populate based on your data showing in rows 14-15 and 19-20.
For your planned duration and load (rows 14-15).
I don’t know your individual plan, and there’s not a one size fits all number to insert there.
You need to look at how you will train, and rest, and then workout the totals per week.
This gets transferred to the target hours/load in the Intervals calendar (activities page).
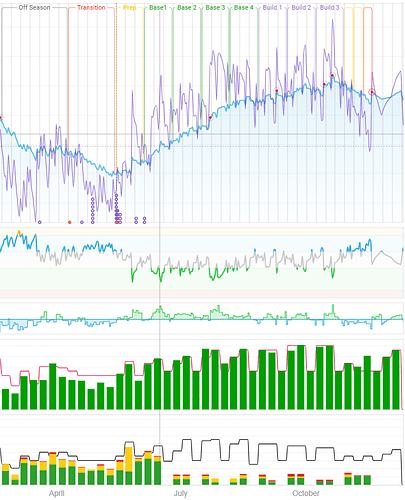
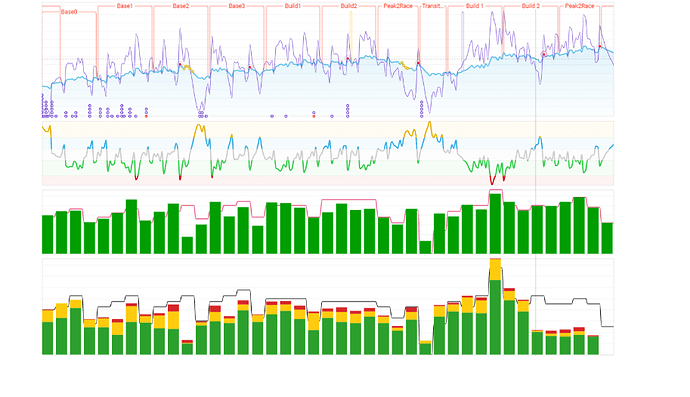
You can see my weekly planned load/hours will show up in the fitness graph (green/black chart).
The mesocycles (base1, base2, base3, etc., shows in the fitness graph to give a visual indication of the various cycles.
Thanks a lot @Gerald and @MedTechCD for your great support!! Now my graph is showing up in the ATP plan from Jan to June…
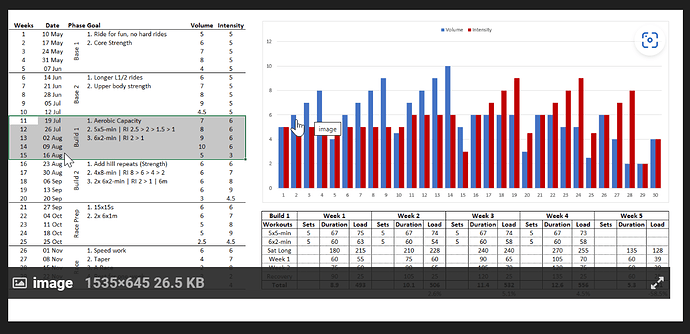
I will now input my goals, races, loads etc. Do you have a template for this planning that you can share with indication of the loads / duration ?
and the big question how to get this visualization?
@david it would be so cool to have all this built-in interval.icu directly
thanks again to everybody !!!
Yves
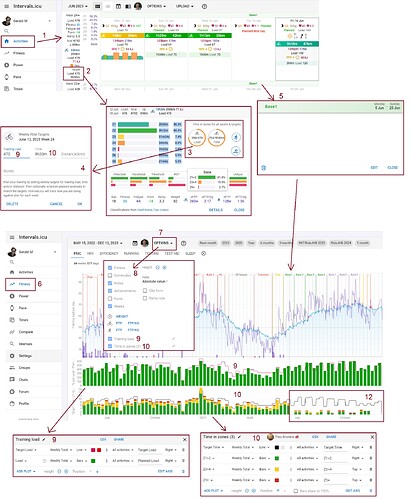
- On Activities Page
- Click on the summary info (left or top, depending on your settings)
- Click on the Bicycle icon (opens 4)
- Add planned load (9) and planned duration (10), as well as distance.
- Adding a note, allows to set for a mesocycle (add date range, and label). Once created, it shows on the fitness page (if block 8 has notes ticked).
- On the Fitness page
- Options opens block 8
- Tick the graphs/charts you wish to view.
- Training Load, for me, shows planned vs actual
- Time in zones, for me, shows planned vs actual
- there is no eleven

- TiZ only shows in the future is a planned workout, using the workout builder shows details.
Thanks a lot Gerald! Now I must identify the loads for swim bike and run workouts… do you know if there is any template or suggestion for 70.3 races, goal 4.40h
And for this is there a template for this that you can share?
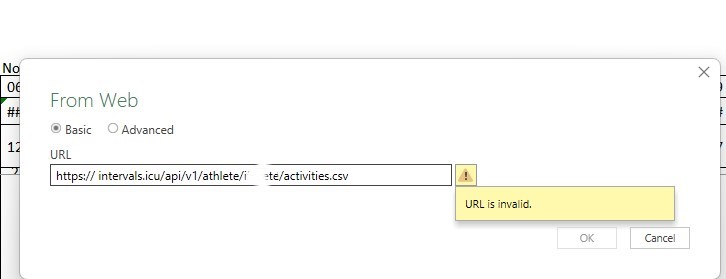
Do you have a space after https://?
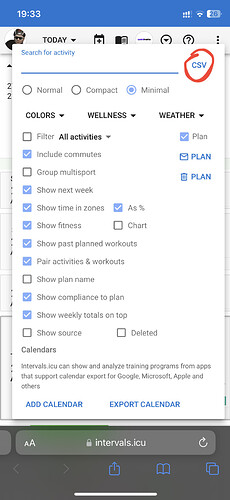
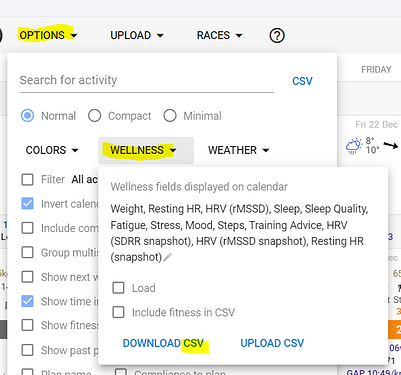
If you right click on the csv link on options (Activity page), it will give you the link without /v1 between APi and athlete. Copy that link, then add the /v1
The problem here, is the url.
From your screenshot, there appears to be a space right after the 2 forward slashes.
Remove that space.
The xxxxx must be your intervals athlete id.
Dumb question… I have created the connection and imported activity data. There’s no ‘Activity’ or Wellnes’ tabs. I’m assuming ‘sheet 2’ is the location to import to and cell A1 is the location for the import?
Dumb question 2:
How do you make the file blank but not break the formulas? The copy I downloded is prepopulated with data.
Thank you!
Did you get the CSV from within the Intervals.icu GUI or did you get the Excel file?
From within the Intervals GUI, you can get:
- csv with activity data as in the screenshot just above
- csv with wellness data
For the ATP (Annual Training Plan), you need the Excel file available from:
Intervals_API_Tools – Google Drive.
Follow the instructions on the ReadMe page and it should populate with your data.
Remove the space between “//” and “intervals”
Do you still need the blank template?
Hi @Gerald . All is well now. Took me a few hours reading through this thread to work out all the steps to get where I want to be. However, maybe I could ask how you work out planned training load for the week, month, and year? and how you then plan weekly sessions based on the load identified? Thank you for taking your time to reply
To work out load or hours is dependent on what you want to achieve, and the time you have available to train.
The following is doable for those with 6-10 hours a week:
If a generic plan of progressive overload is acceptable, start from the 20-min “FTP” test, then progress TIZ, at threshold power, until you can do about an hour’s worth of TIZ. Look to increase 5-6 mins per week, so 20-24-30-36, 39-44-50-54-60 (this could be intervals of 3x8, 2x15, 3x12, 4x10, 3x13, 2x25 and 3x20 with 2x30 as a final effort if you’re feeling good after 12 weeks. The rest period between intervals is traditionally 50% of the work interval, so that gives you an idea of how long each workout will be with a 10-20 minute warmup. No cool down is required if you do the last recovery interval.
That will take you 12 weeks, with 3 recovery weeks included, where you don’t do any threshold work. Then retest and repeat, or add some intensity (intensive).
That’s one of the higher intensity level workouts, of two, for the week. A second session could be either VO2 work or Tempo. Everything else can be Z2 (of 5) that would be below LT1 for as long as you have time. Power is what it is, and HR/RPE would be a better limiter of when it becomes too hard. Note that HR fluctuates based on heat, dehydration, caffeine, poor sleep, fatigue and other factors. The easy rides should “feel” easy.
Fantastic! Thank you @Gerald. I am currently 7 weeks out from a mile race and I am looking to generate a pyramidal structured plan to prepare me for the race. The explanation you gave me is excellent! Maximising time available in the week will definitely help me. However, is there any other way of working out planned TSS score that I may later use in the excel template for future planning?
Hi, I get a expression error “rampRate” column not found, but it is still there. Can anyone help me?


Reading back up to the top of this thread, are you using the template I shared in Aug-22?
I use the 1.6 of the Intervals_API_Tools – Google Drive
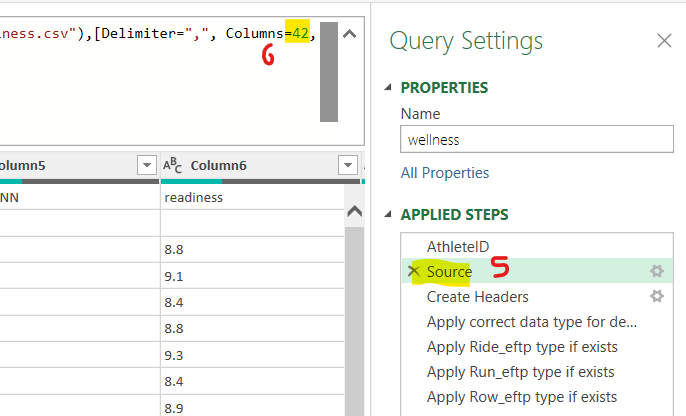
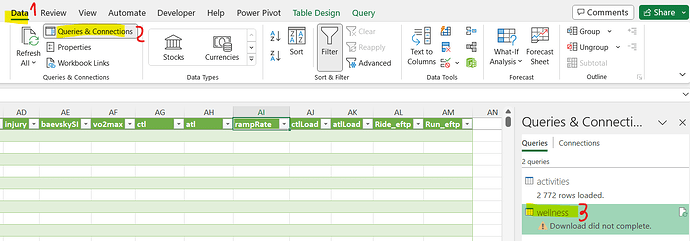
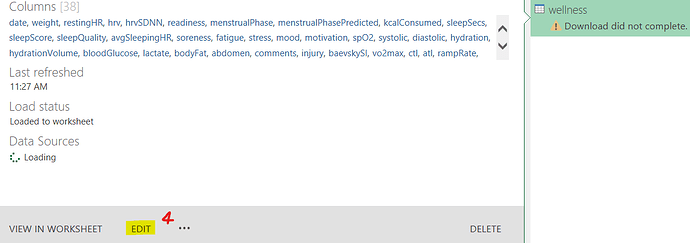
Totally forgot about that but you need to ‘Edit’ the Query for both Wellness and Activities by removing the Columns=xx in the Source step of the query
In Excel,
-
Click on Data ribbon
-
Queries Connections
-
Hover over the Wellness word (right)
-
Click on edit (to open the query)
-
Click on Source
-
Change the column count to 42 (the close and load - top left).
There are 38 columns, but for some reason it works when the number is 42.
edit: after updating to 42, there are 42 headers
