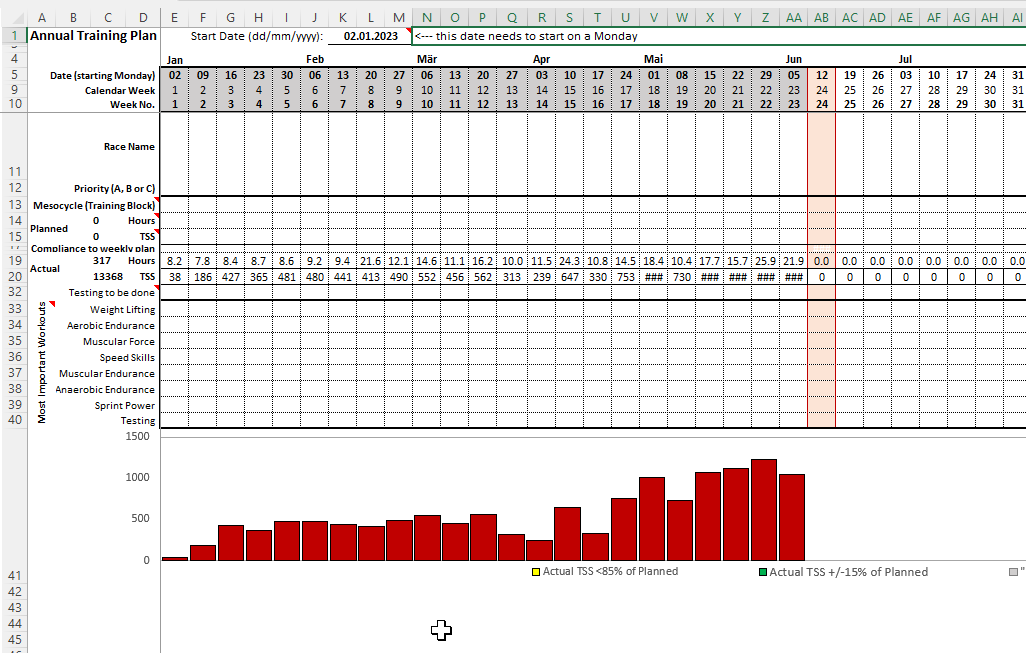
At some point there was a problem with week numbering. Looks like I removed the formula in this version.
You may find the correct formula when following this:
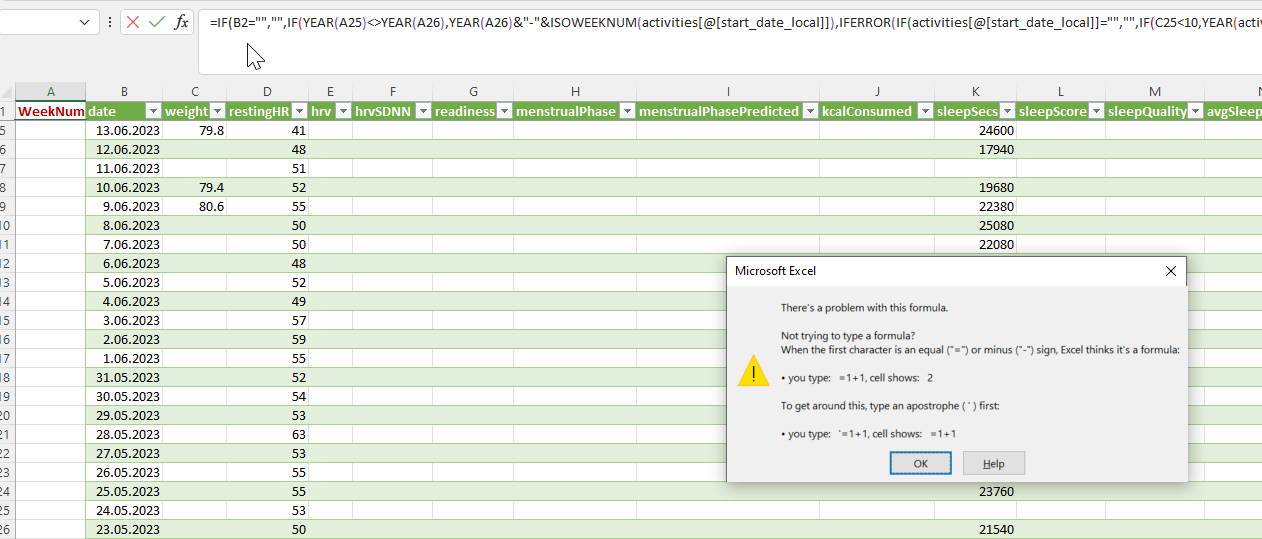
tried the formula =IF(G25="","",IF(YEAR(A25)<>YEAR(A26),YEAR(A26)&"-"&ISOWEEKNUM(activities[@[start_date_local]]),IFERROR(IF(activities[@[start_date_local]]="","",IF(C25<10,YEAR(activities[@[start_date_local]])&"-0"&C25,YEAR(activities[@[start_date_local]])&"-"&C25)),""))) and substituted G24 to B5 but excel says:
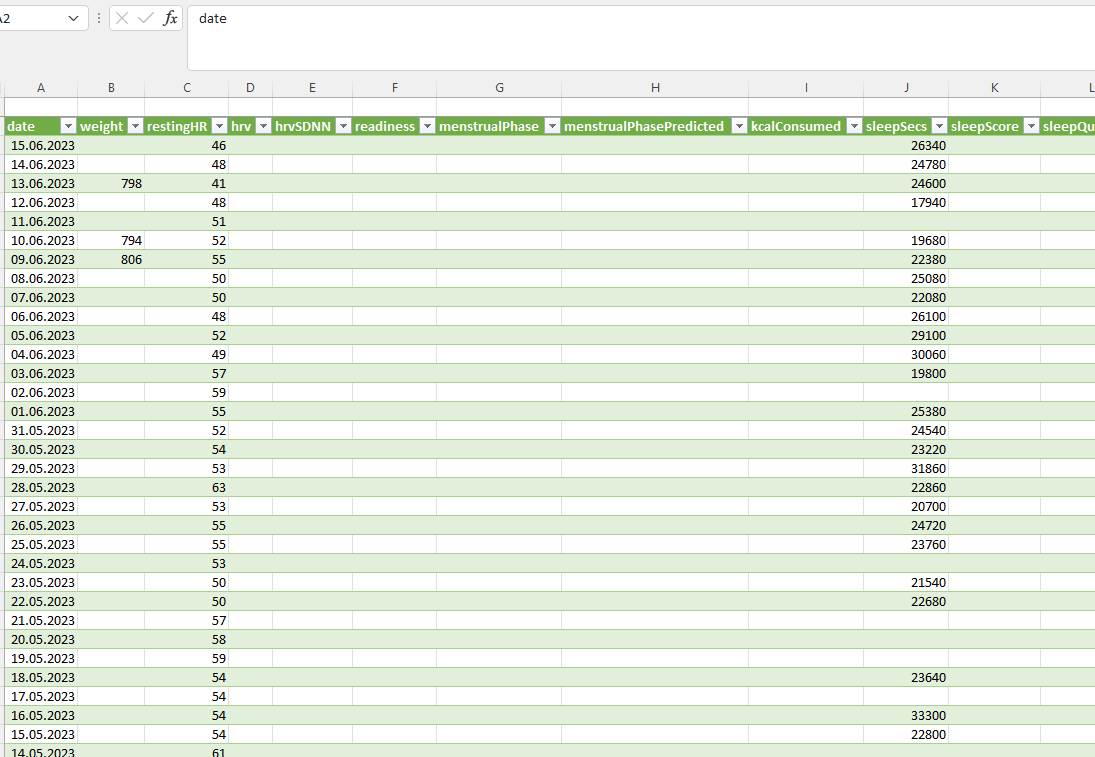
It picks up the date in B5 and converts it to the week number.
Before that, =year(b5)&”-“&isoweeknum is used to create yyyy-weeknum so that you can sort by year.
However, weeks 1-9 will show a single digit, so the if(isoweeknum(b5)<10,year(b5)&”-0”&isoweeknum(b5),year(b5)&”-“&isoweeknum(b5)) is used to create a double digit week number after the year.
I have just uploaded a 1.6 version of the API_TOOLS excel file which has a formula for the week numbers (ISO format) and respects the format needed for the ATP plan (yyyy-ww).
It’s available at the same link.
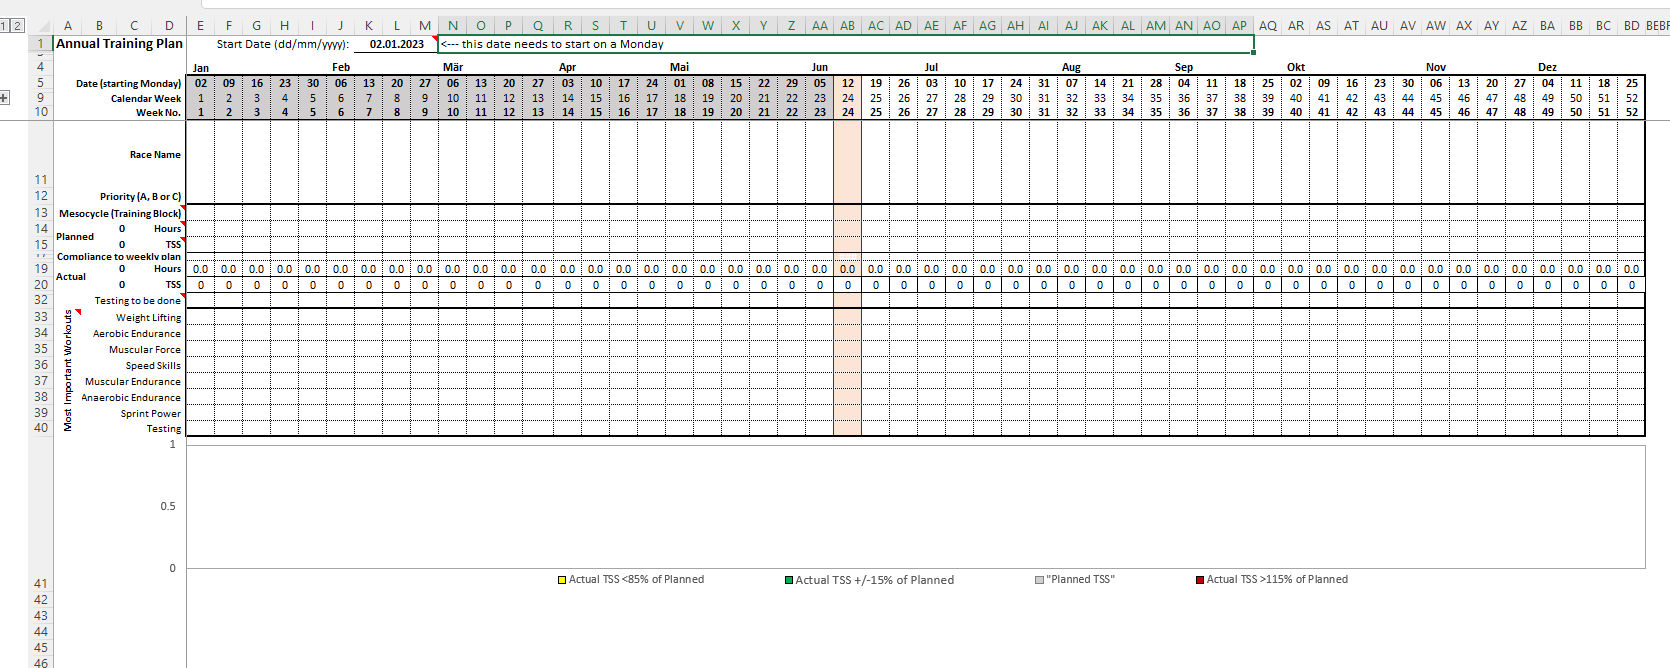
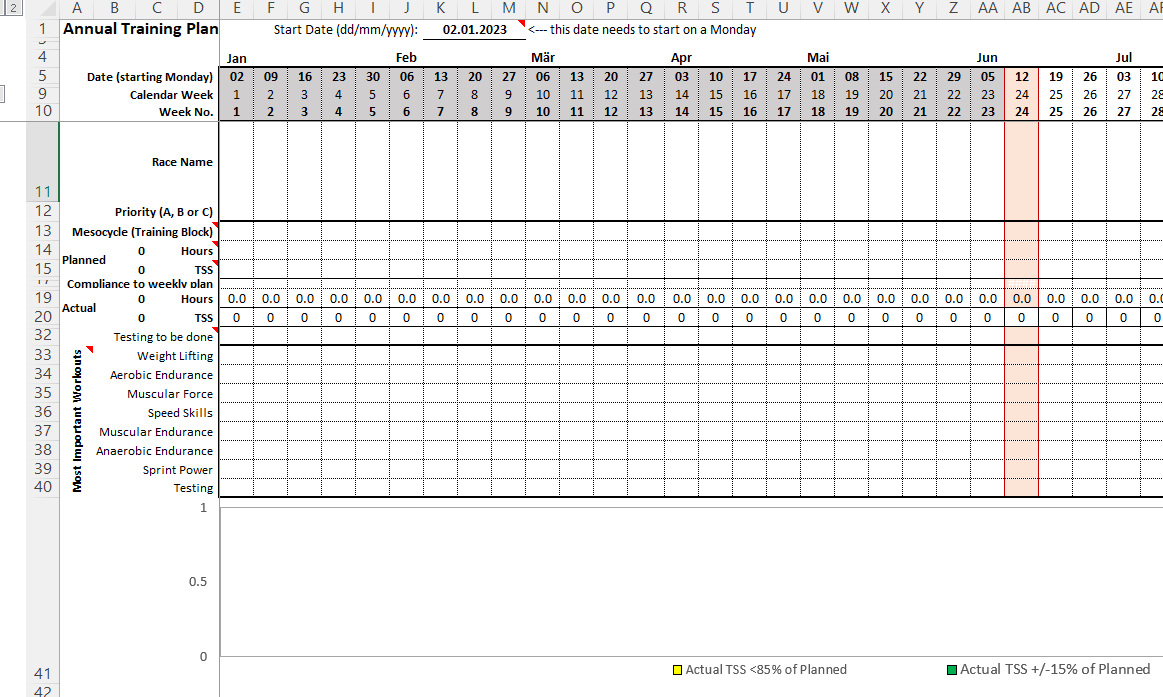
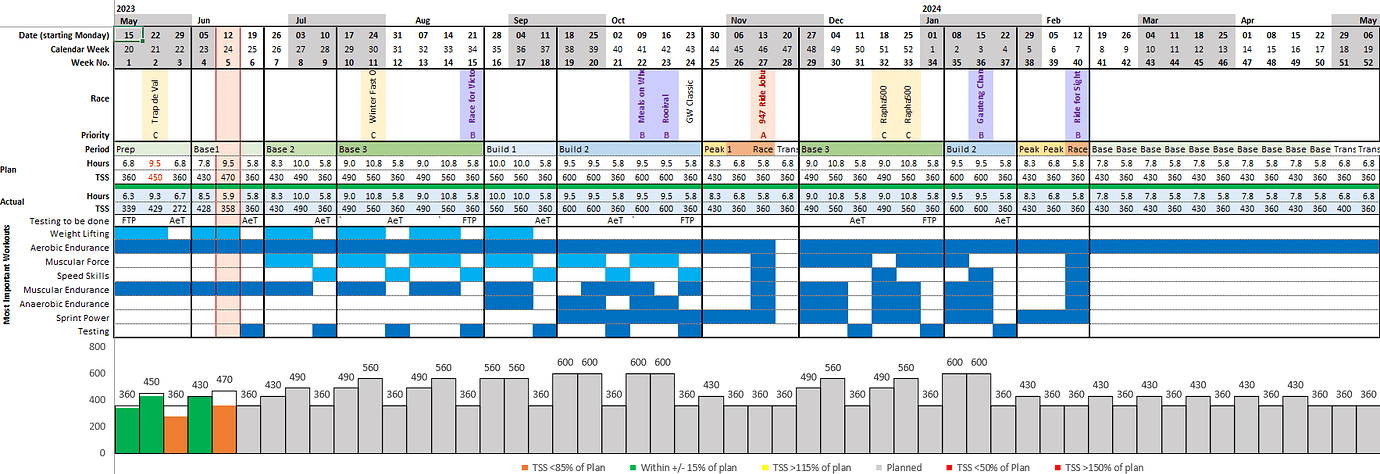
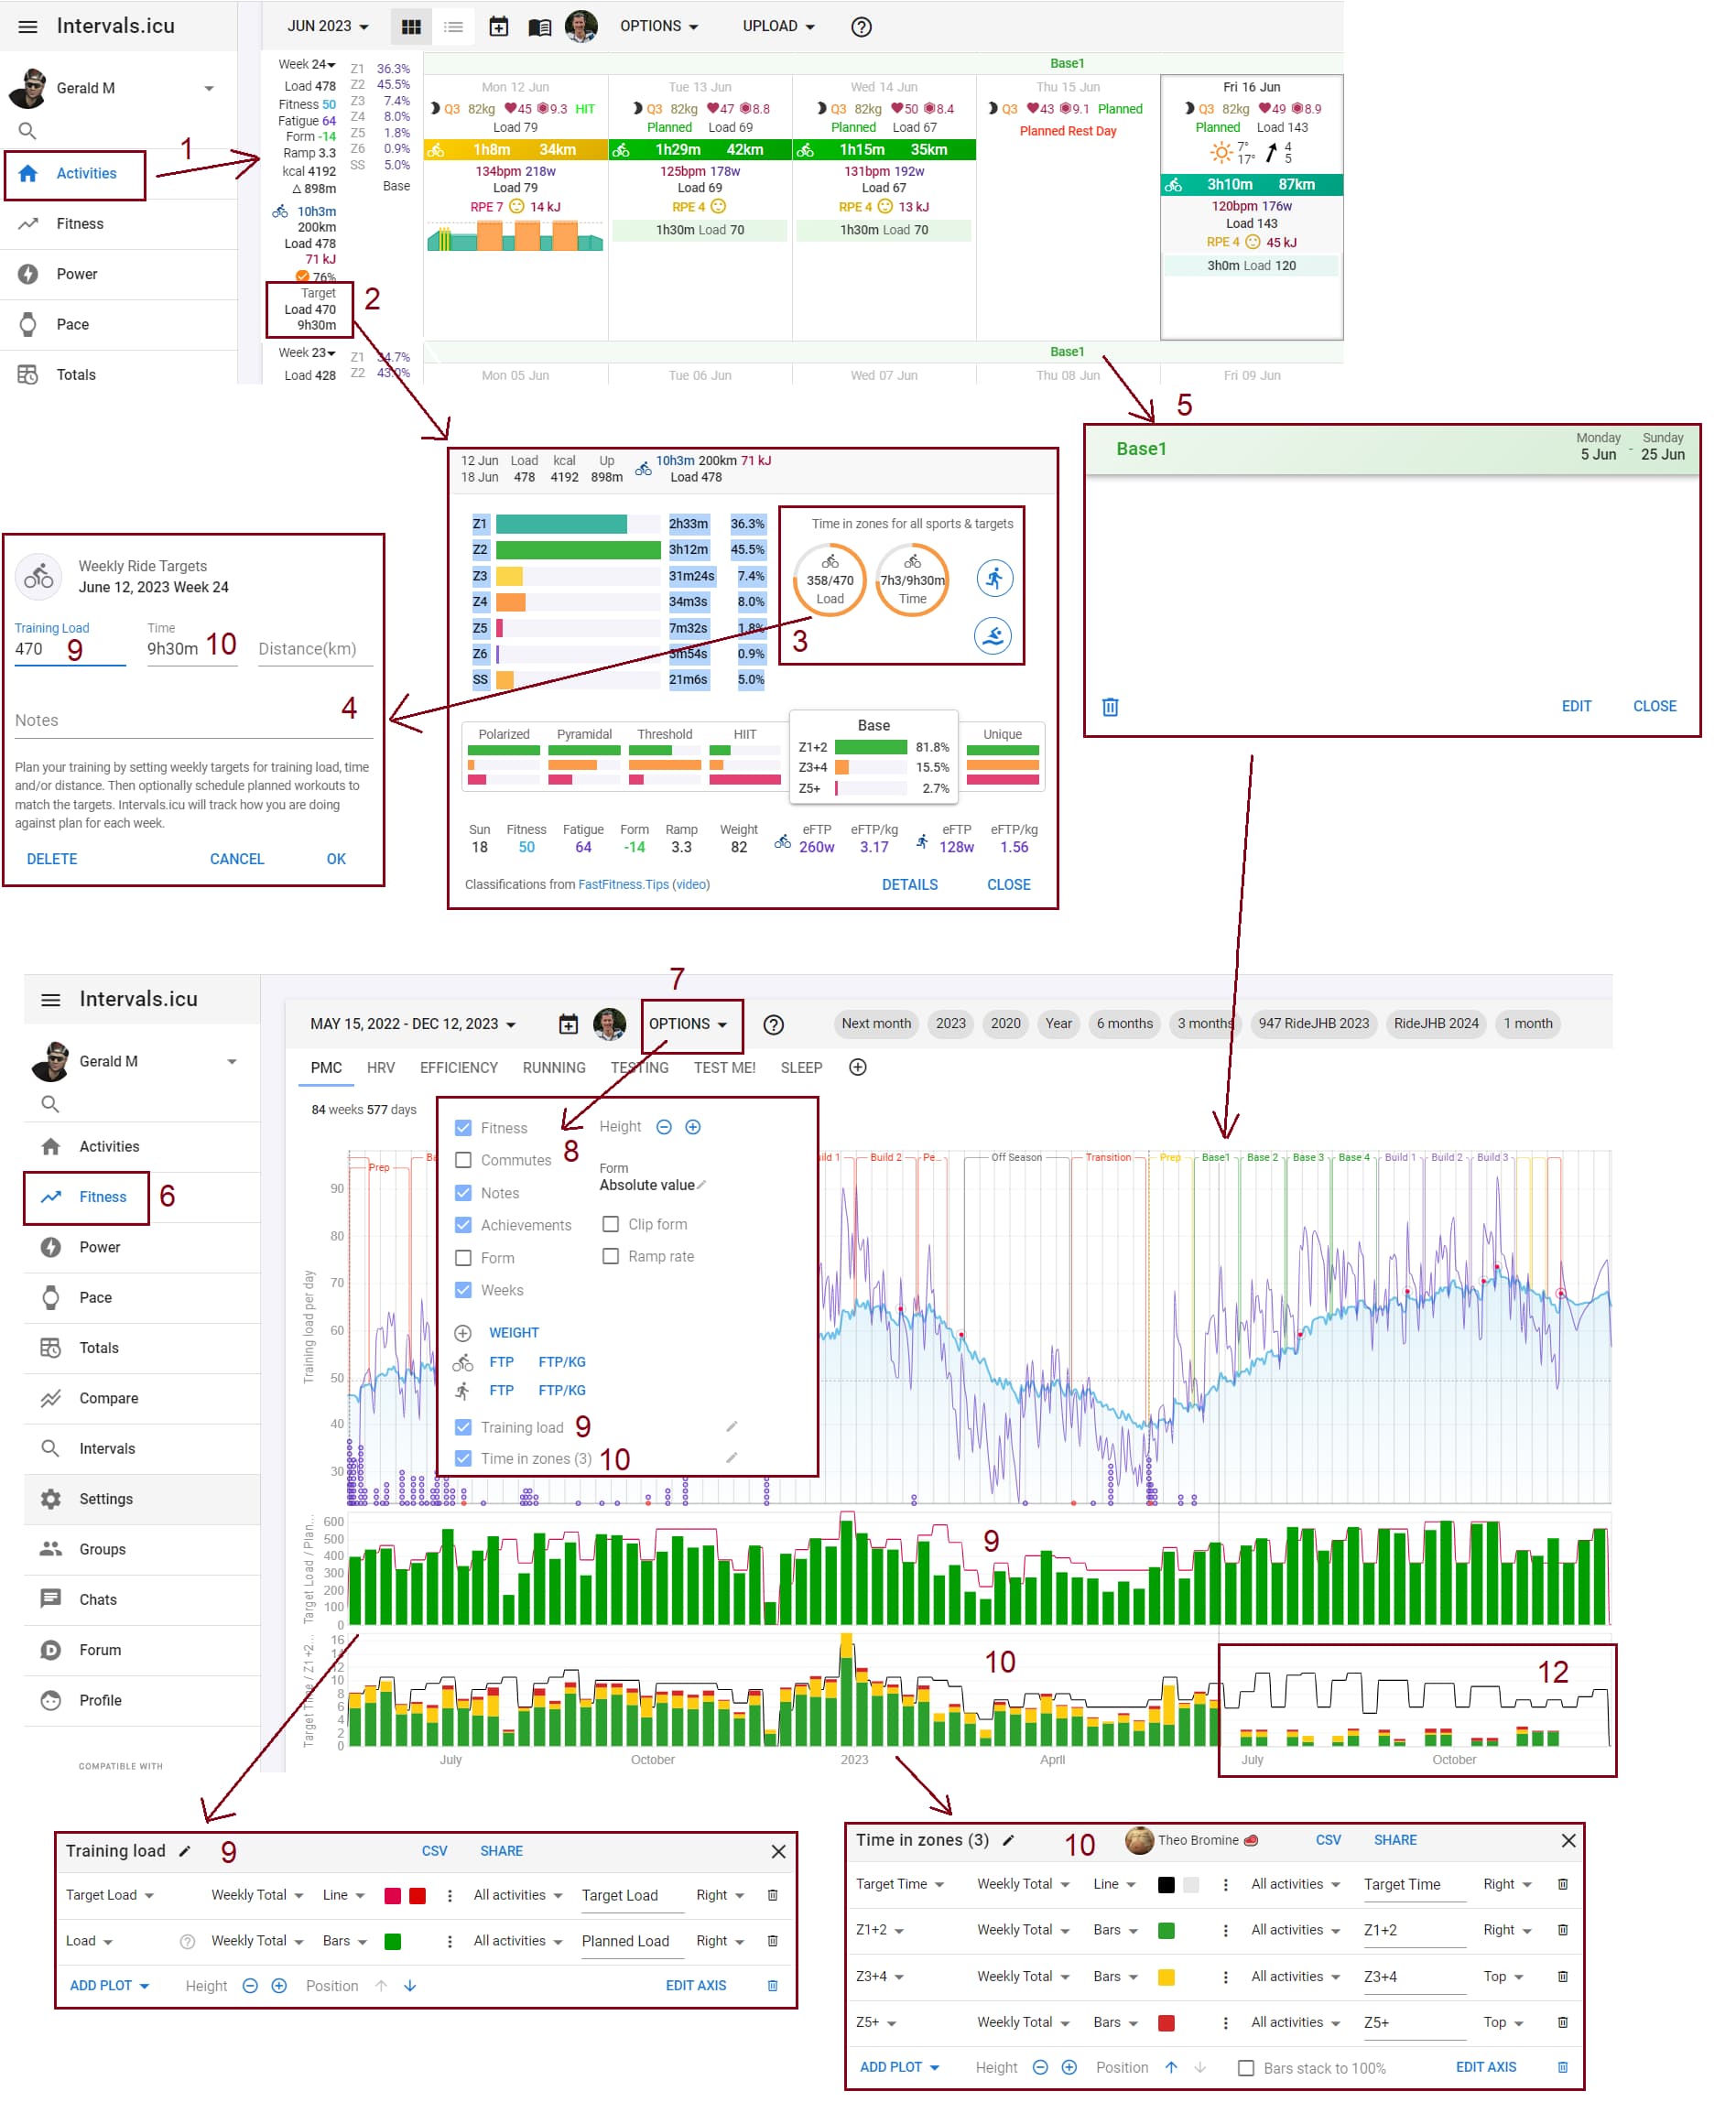
It has now created a year plan for the next 52 weeks (rows 9 & 10 show the calendar week and plan week; which can be different depending on the start date of the plan.
Row 13 is the mesocycle week, eg. base1, base2, build1, taper & race, etc.
Rows 14-15 are the sum of the planned weekly hours/load.
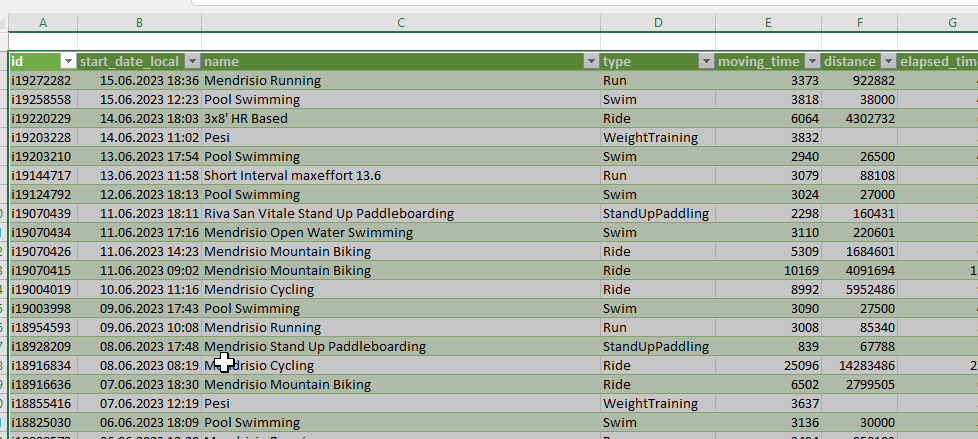
Rows 19-20 are the sum of the actual weekly hours/load, that you would get from the activities tab.
Row 16-17-18 are showing if you are compliant to the plan, eg. <50% (red), 50-85% (yellow), 85-115% (green) or 115-150% (yellow) or >150% (red).
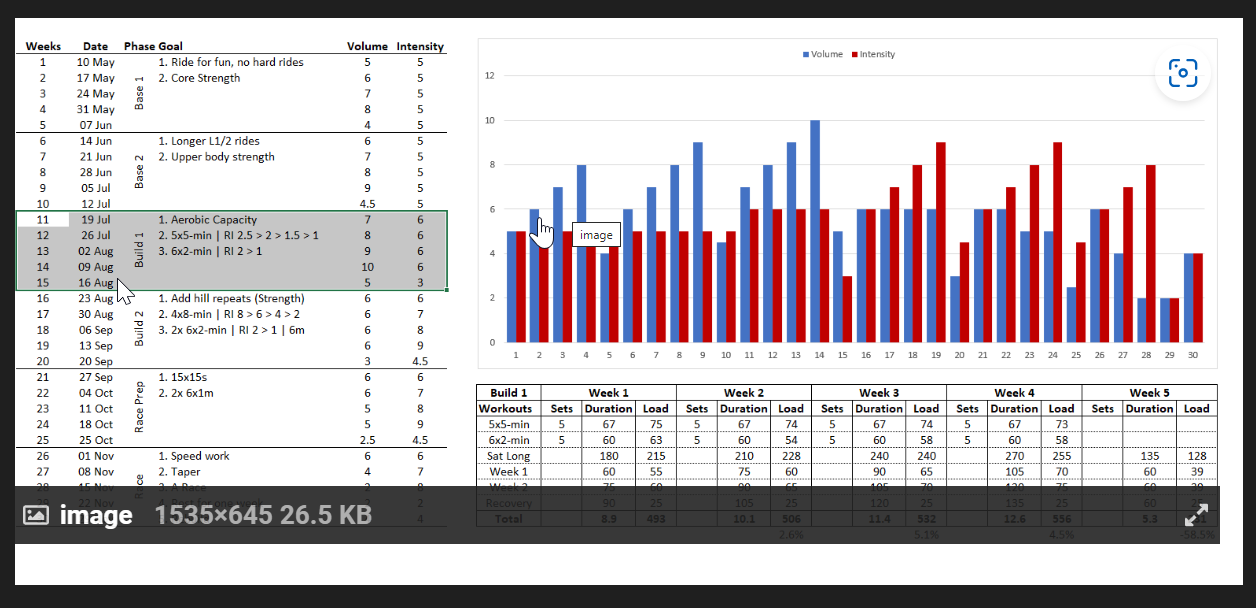
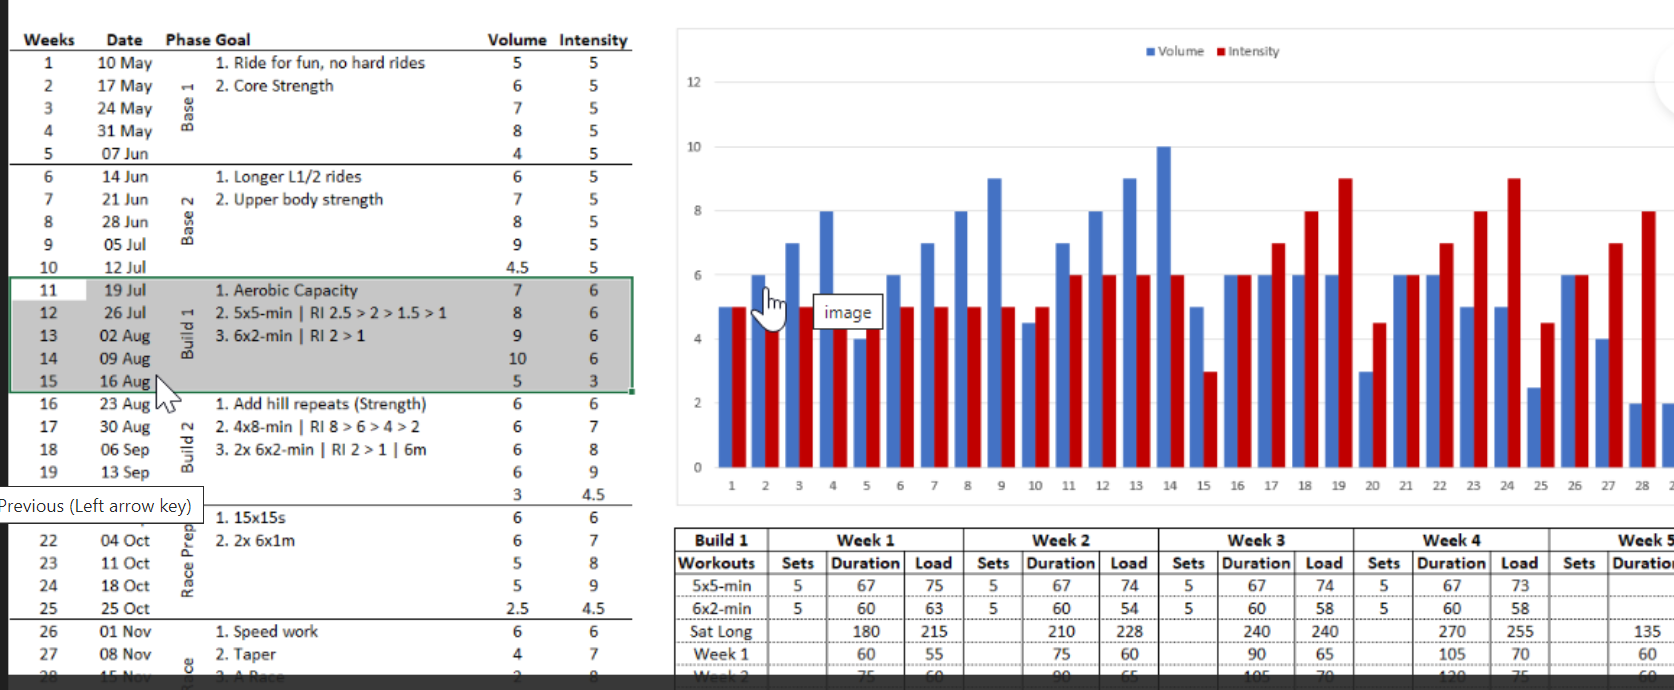
Rows 32-40 shows the testing and areas to target. 1 = primary goal, 2 = secondary goal
the graph in row 41 will populate based on your data showing in rows 14-15 and 19-20.
For your planned duration and load (rows 14-15).
I don’t know your individual plan, and there’s not a one size fits all number to insert there.
You need to look at how you will train, and rest, and then workout the totals per week.
This gets transferred to the target hours/load in the Intervals calendar (activities page).
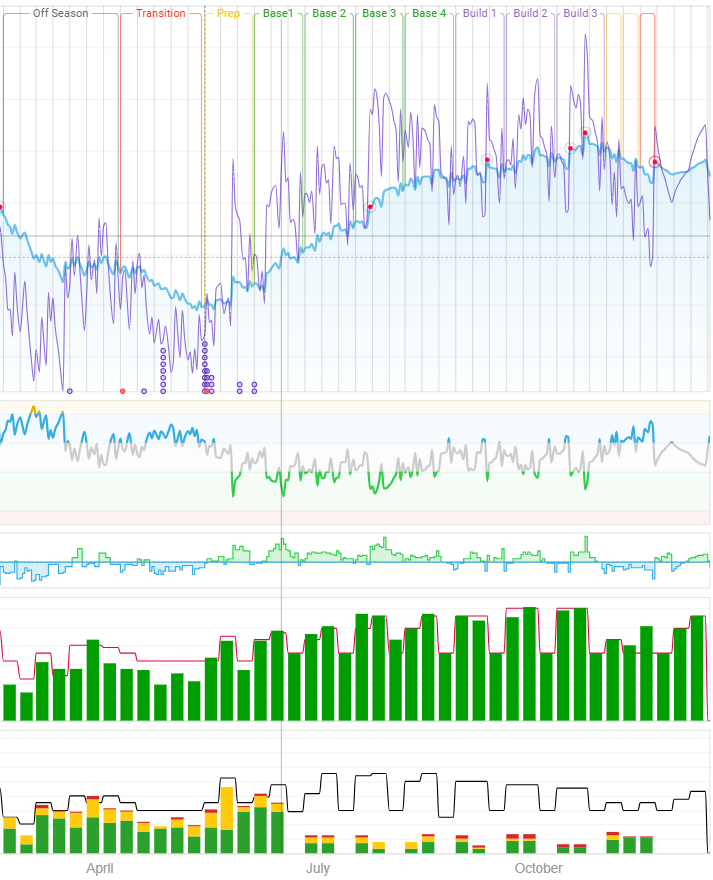
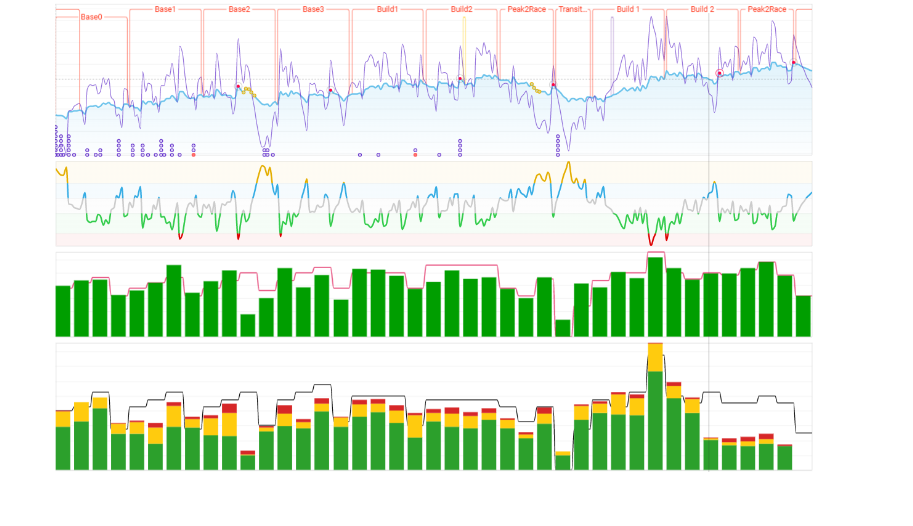
You can see my weekly planned load/hours will show up in the fitness graph (green/black chart).
The mesocycles (base1, base2, base3, etc., shows in the fitness graph to give a visual indication of the various cycles.
Thanks a lot Gerald! Now I must identify the loads for swim bike and run workouts… do you know if there is any template or suggestion for 70.3 races, goal 4.40h
And for this is there a template for this that you can share?
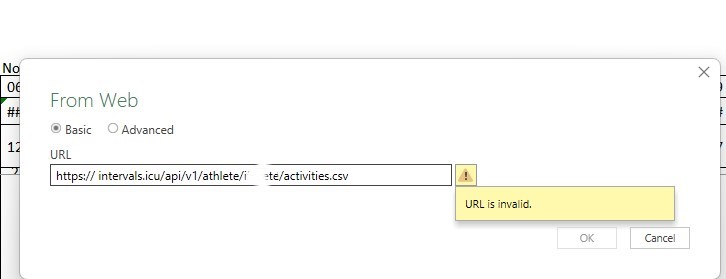
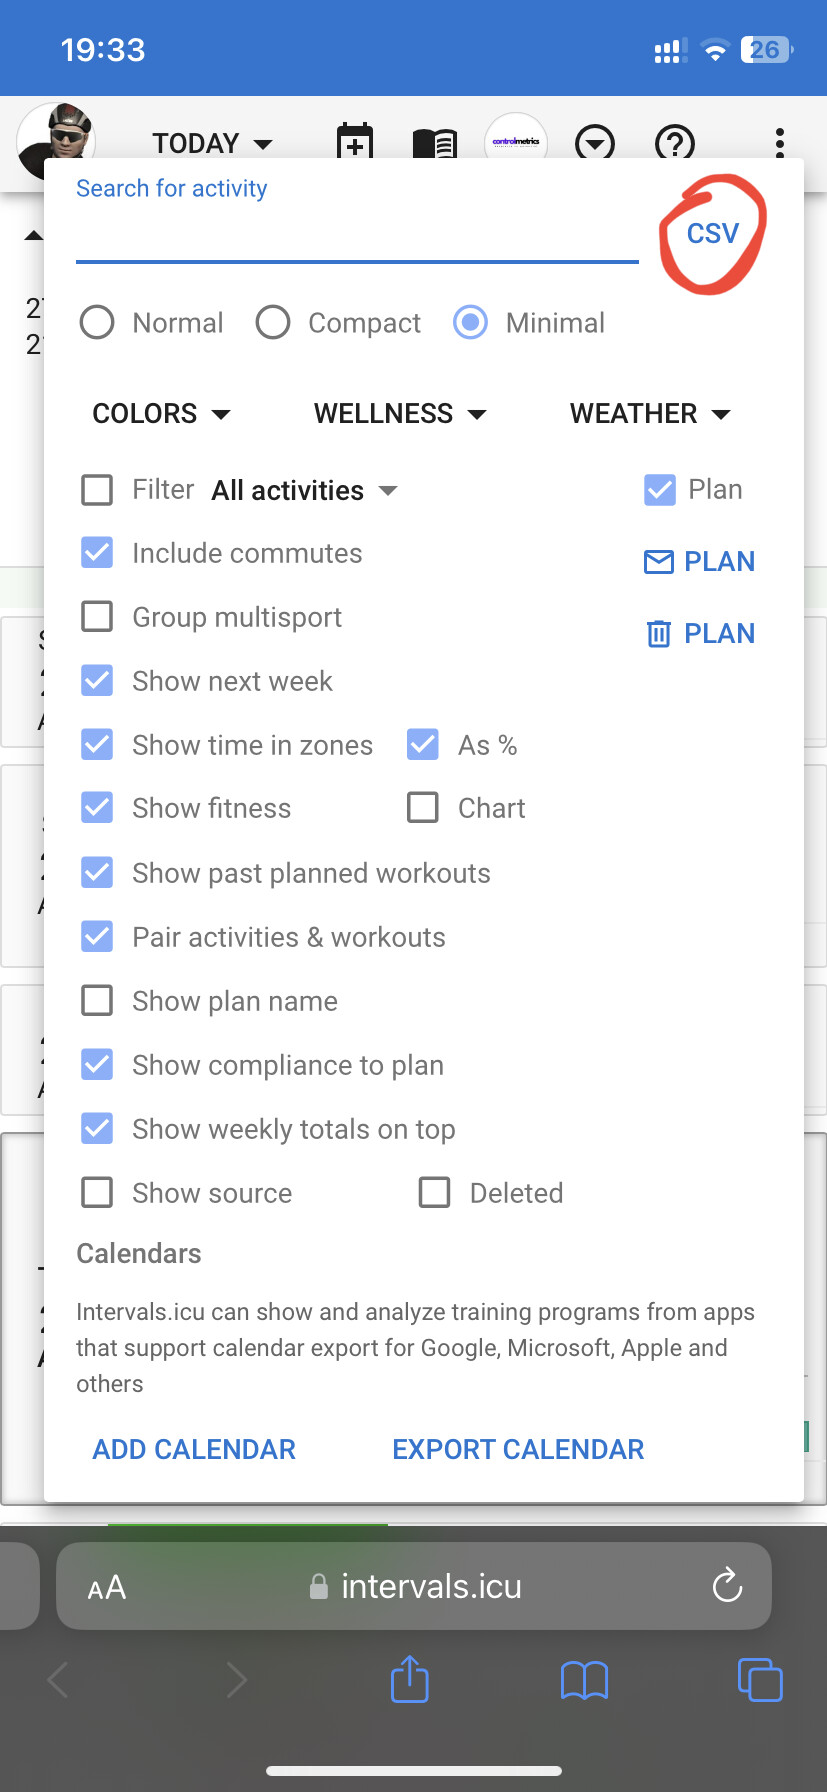
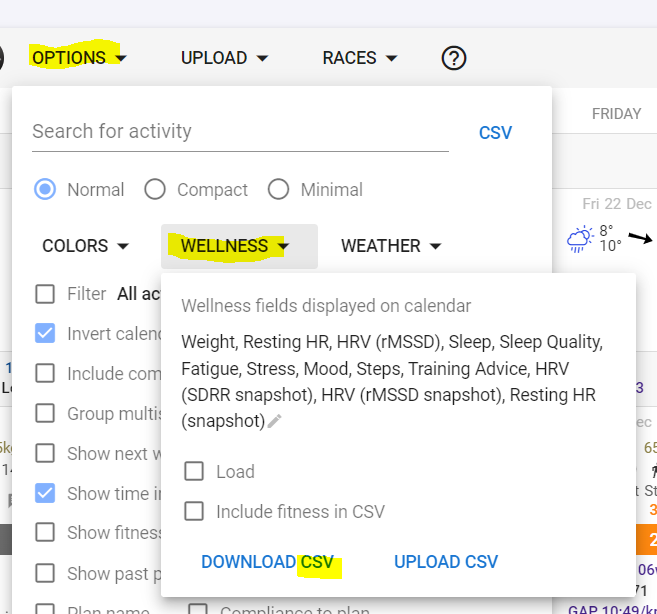
If you right click on the csv link on options (Activity page), it will give you the link without /v1 between APi and athlete. Copy that link, then add the /v1
The problem here, is the url.
From your screenshot, there appears to be a space right after the 2 forward slashes.
Remove that space.
The xxxxx must be your intervals athlete id.
Dumb question… I have created the connection and imported activity data. There’s no ‘Activity’ or Wellnes’ tabs. I’m assuming ‘sheet 2’ is the location to import to and cell A1 is the location for the import?
Dumb question 2:
How do you make the file blank but not break the formulas? The copy I downloded is prepopulated with data.
For the ATP (Annual Training Plan), you need the Excel file available from: Intervals_API_Tools – Google Drive.
Follow the instructions on the ReadMe page and it should populate with your data.