I’ve only been here a month or so but really like this whole thing. It reminds me of the OG desktop version of SportsTracks.
But anyways. I’ve come to enjoy using efficiency (power/hr) for a sensitive marker of fitness and how a ride went overall in the context of fatigue, temperature, if I’m sick, etc, .
Is there a similar one for pace when running. I’ve looked but didn’t see anything. Something like gap/z2hr.
If you don’t have a running power meter there won’t be anything built in. But there are some fields created by users that would do exactly what you want. Some use GAP some use AvgPace
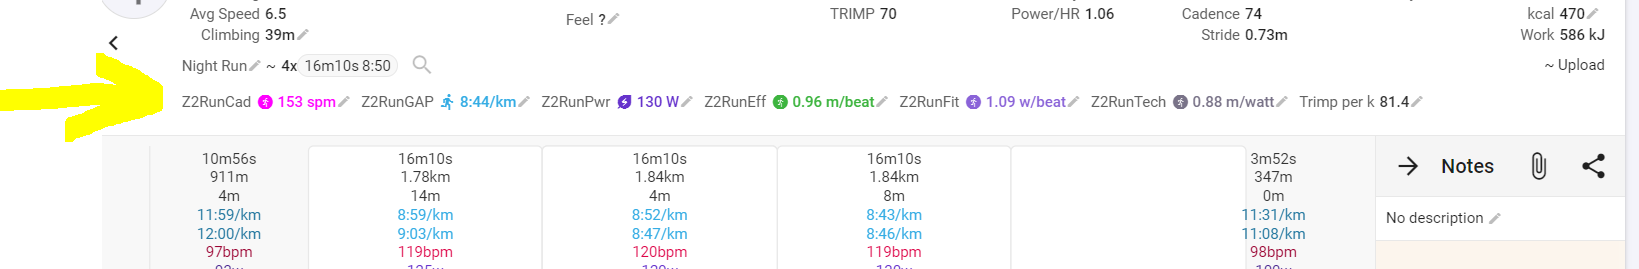
I made a set of custom fields (Cadence, Power, GAP, Efficiency, Fitness and Technique).
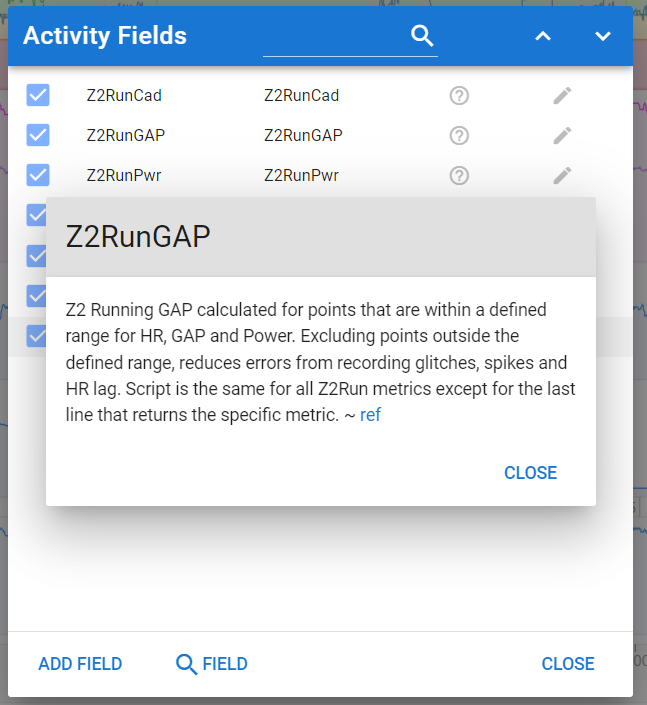
Make sure to read the remarks in the script and the linked forum thread to get what you’re after.
The metrics Efficiency, Fitness and Technique are based on the book ‘Running with power’ by Jim Vance.
A better cardiovascular system increases Fitness (more power per heartbeat). A better running technique increases the distance covered per watt (bouncing your center of gravity up and down eats a lot of power that is not contributing to horizontal movement). The product of both is Efficiency in meter/heartbeat, speed at equal internal effort, that’s what your after.
Cadence increase is for most beginning runners the best way to improve technique. Power increase is the result of improving cardiovascular fitness. Breaking it down like this gives you the opportunity to focus on one or the other for a period. Focus on higher cadence for a couple of runs makes your body adapt quite fast and while at first, you may find it difficult and performance (speed) is not improving or maybe even reducing, the higher cadence will quickly result in speed gains a the same HR.
Running more frequently and/or longer, will increase cardiovascular performance.
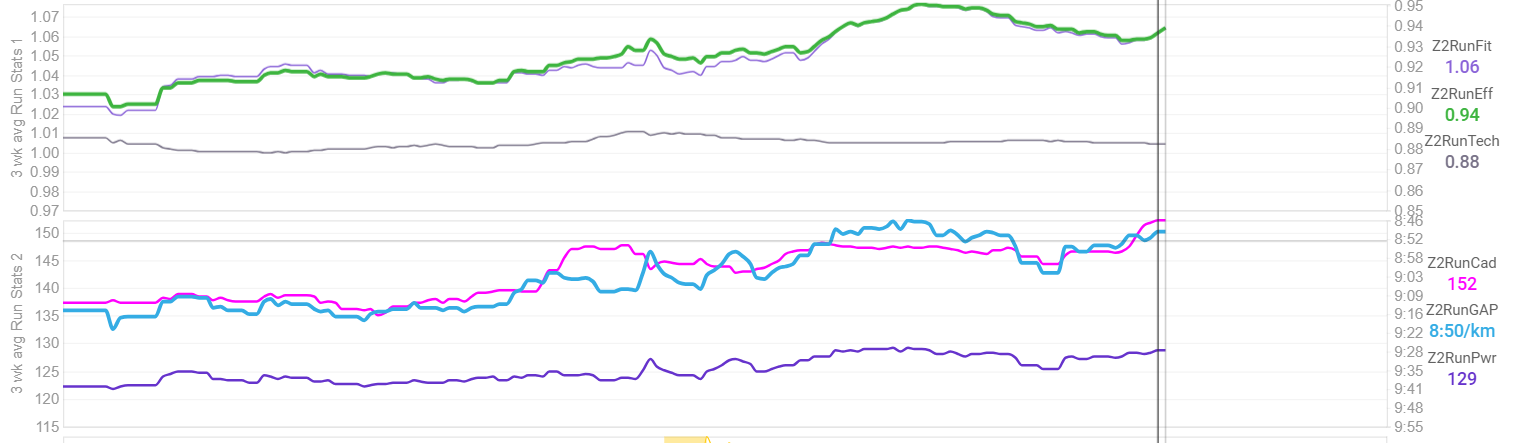
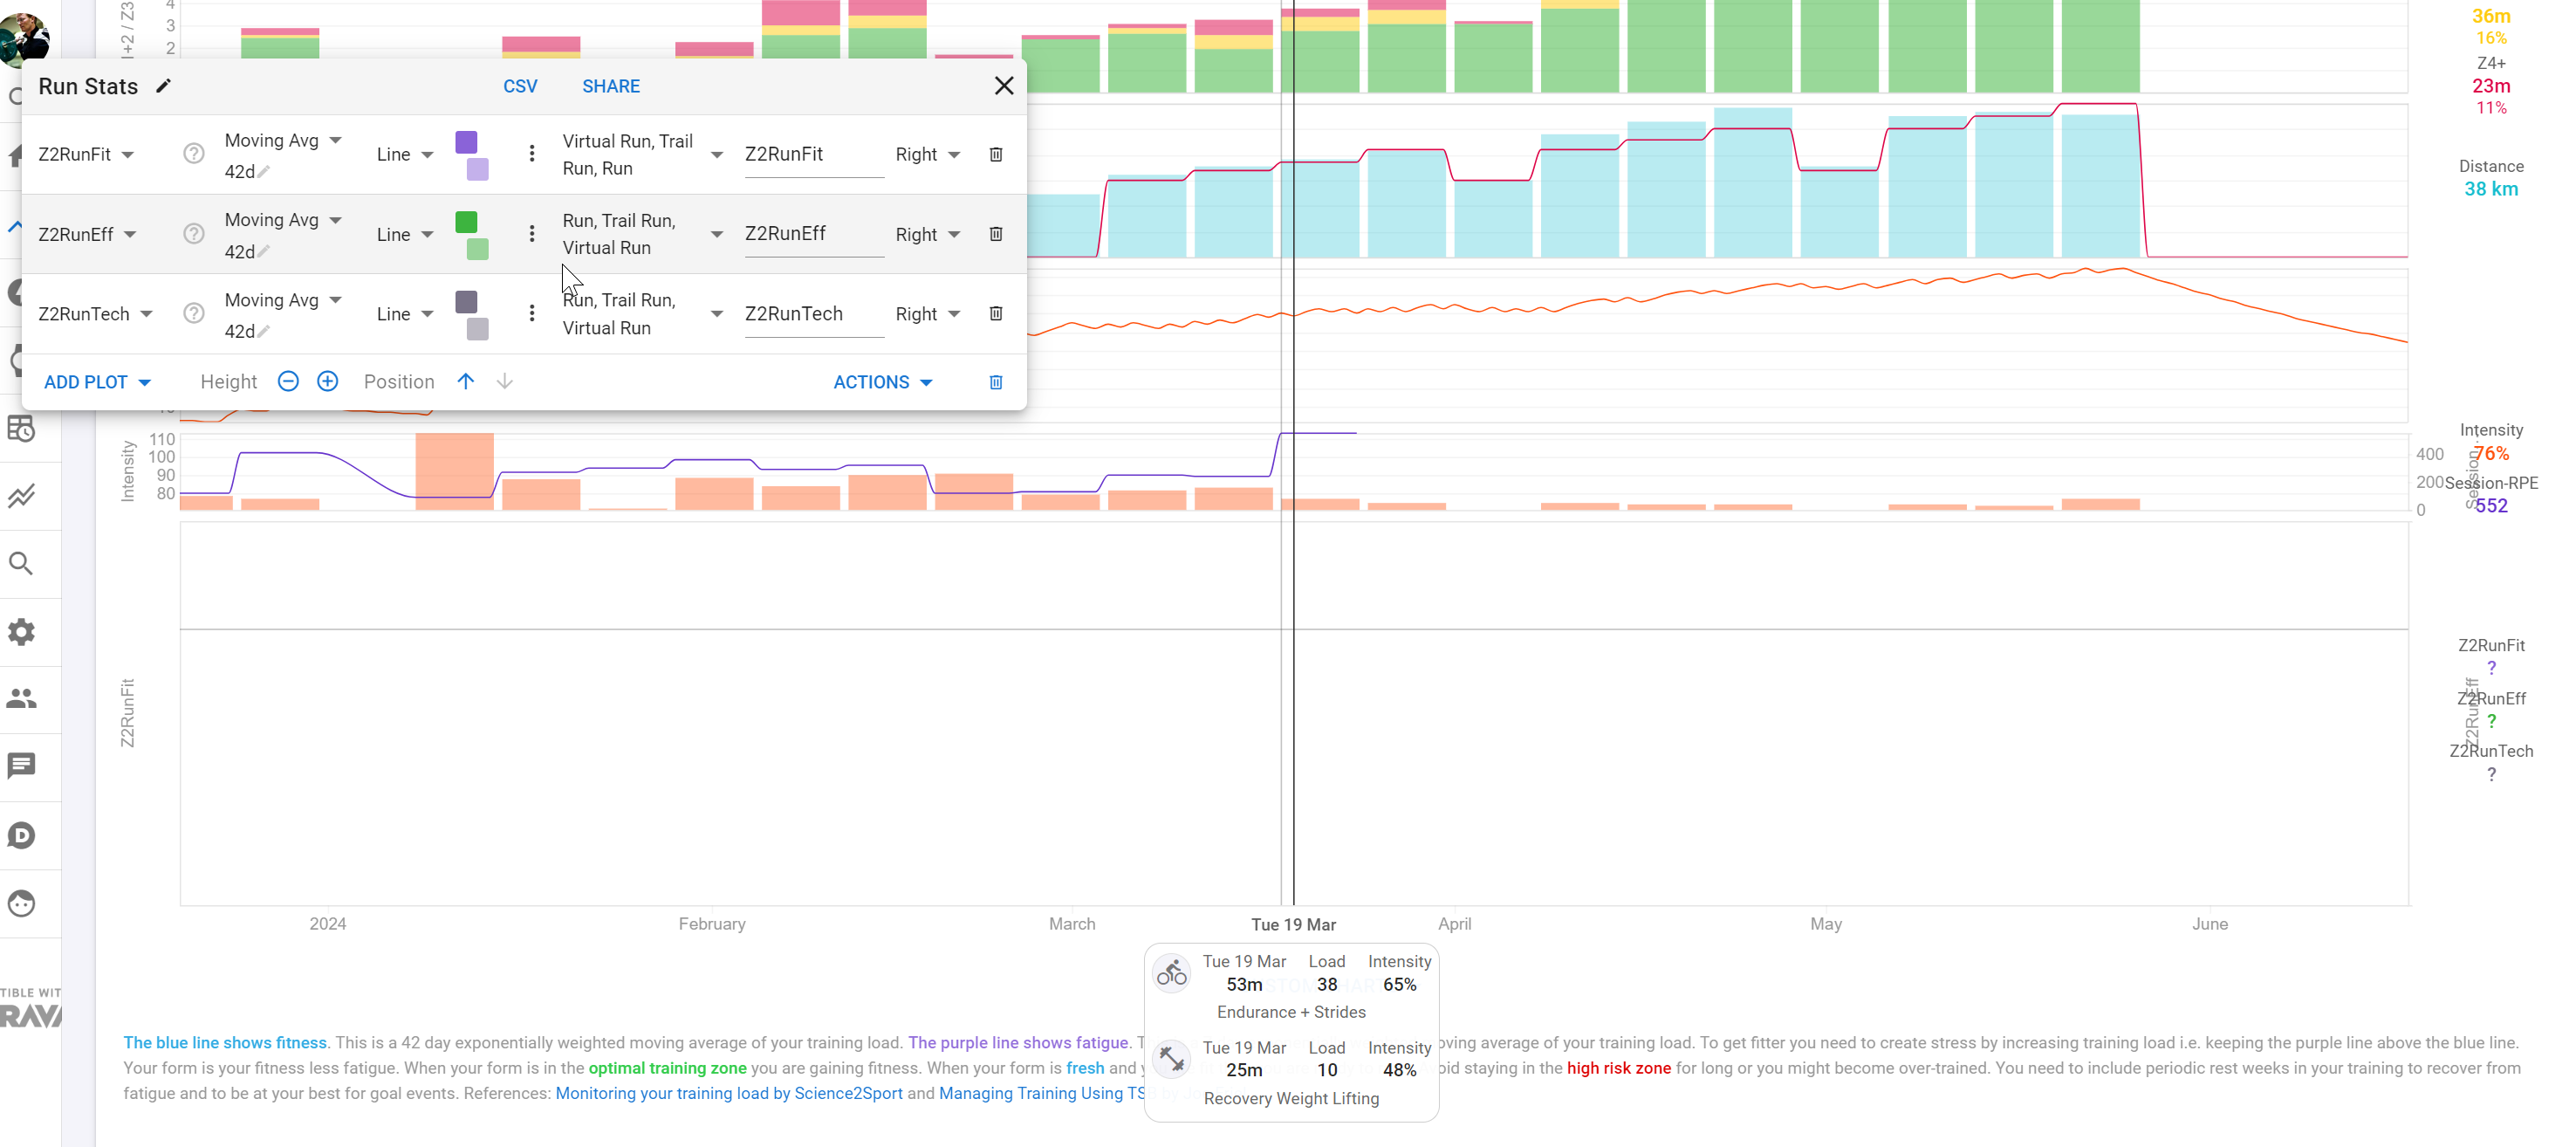
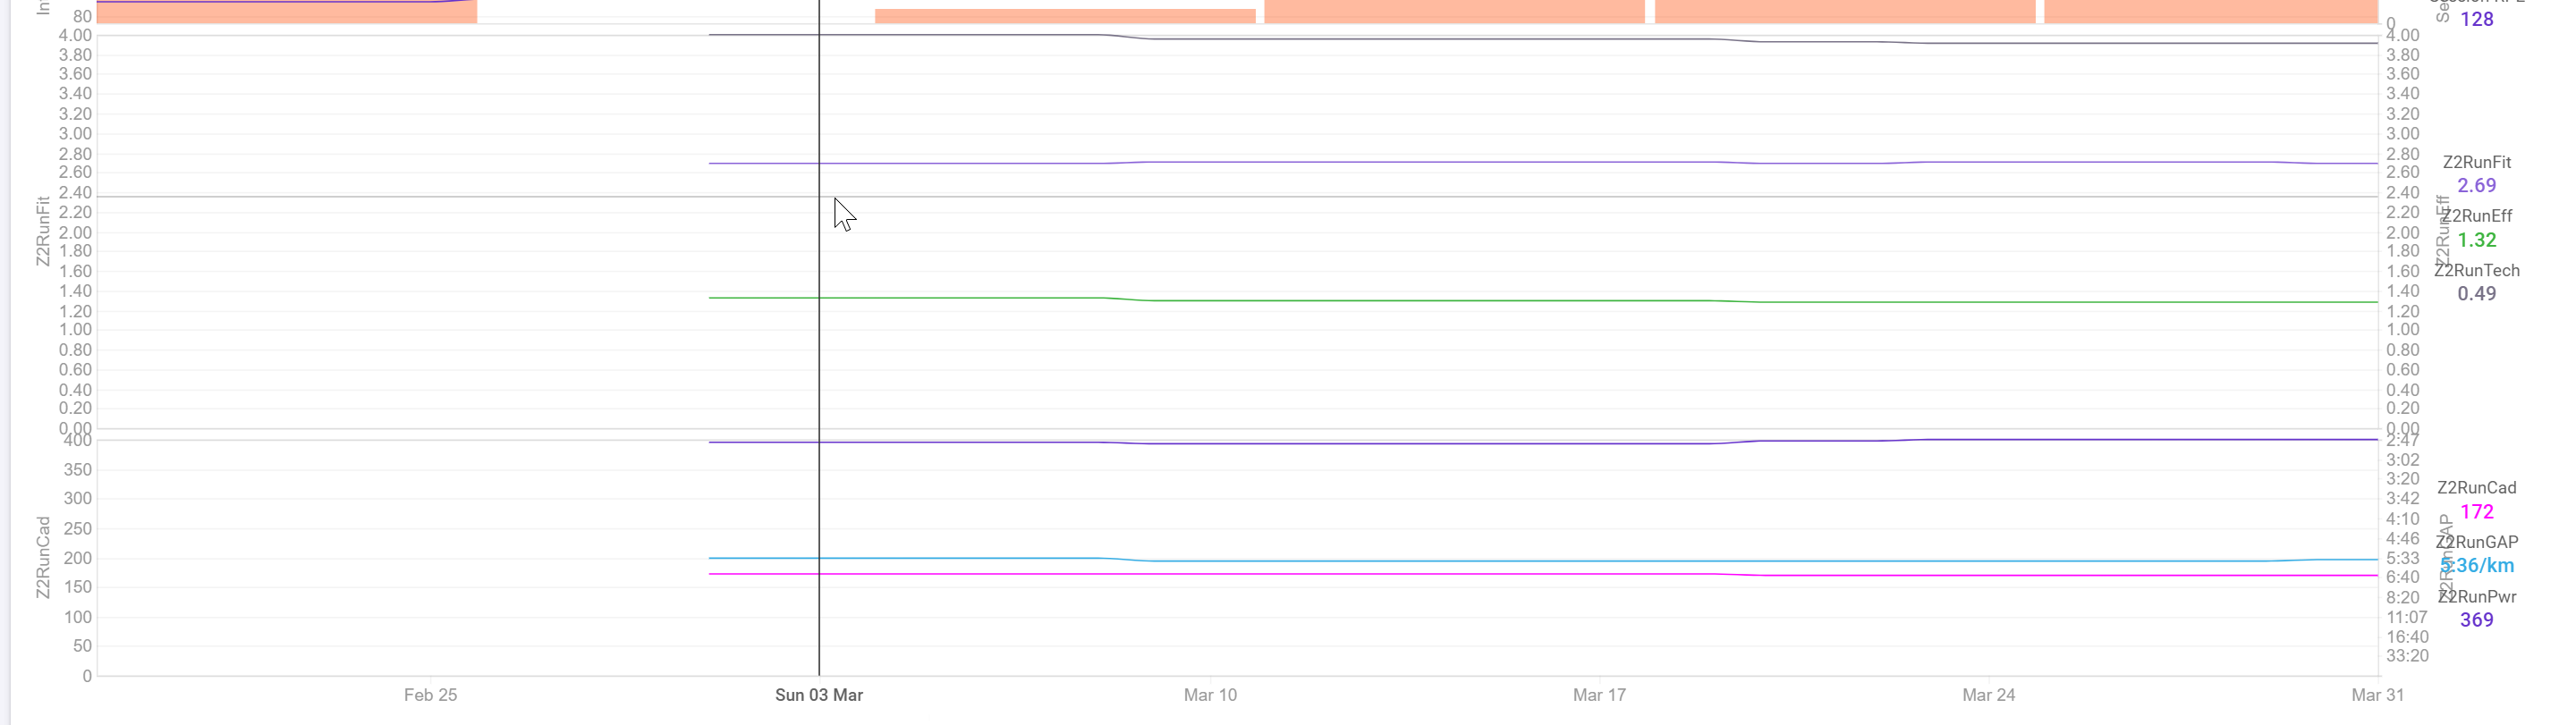
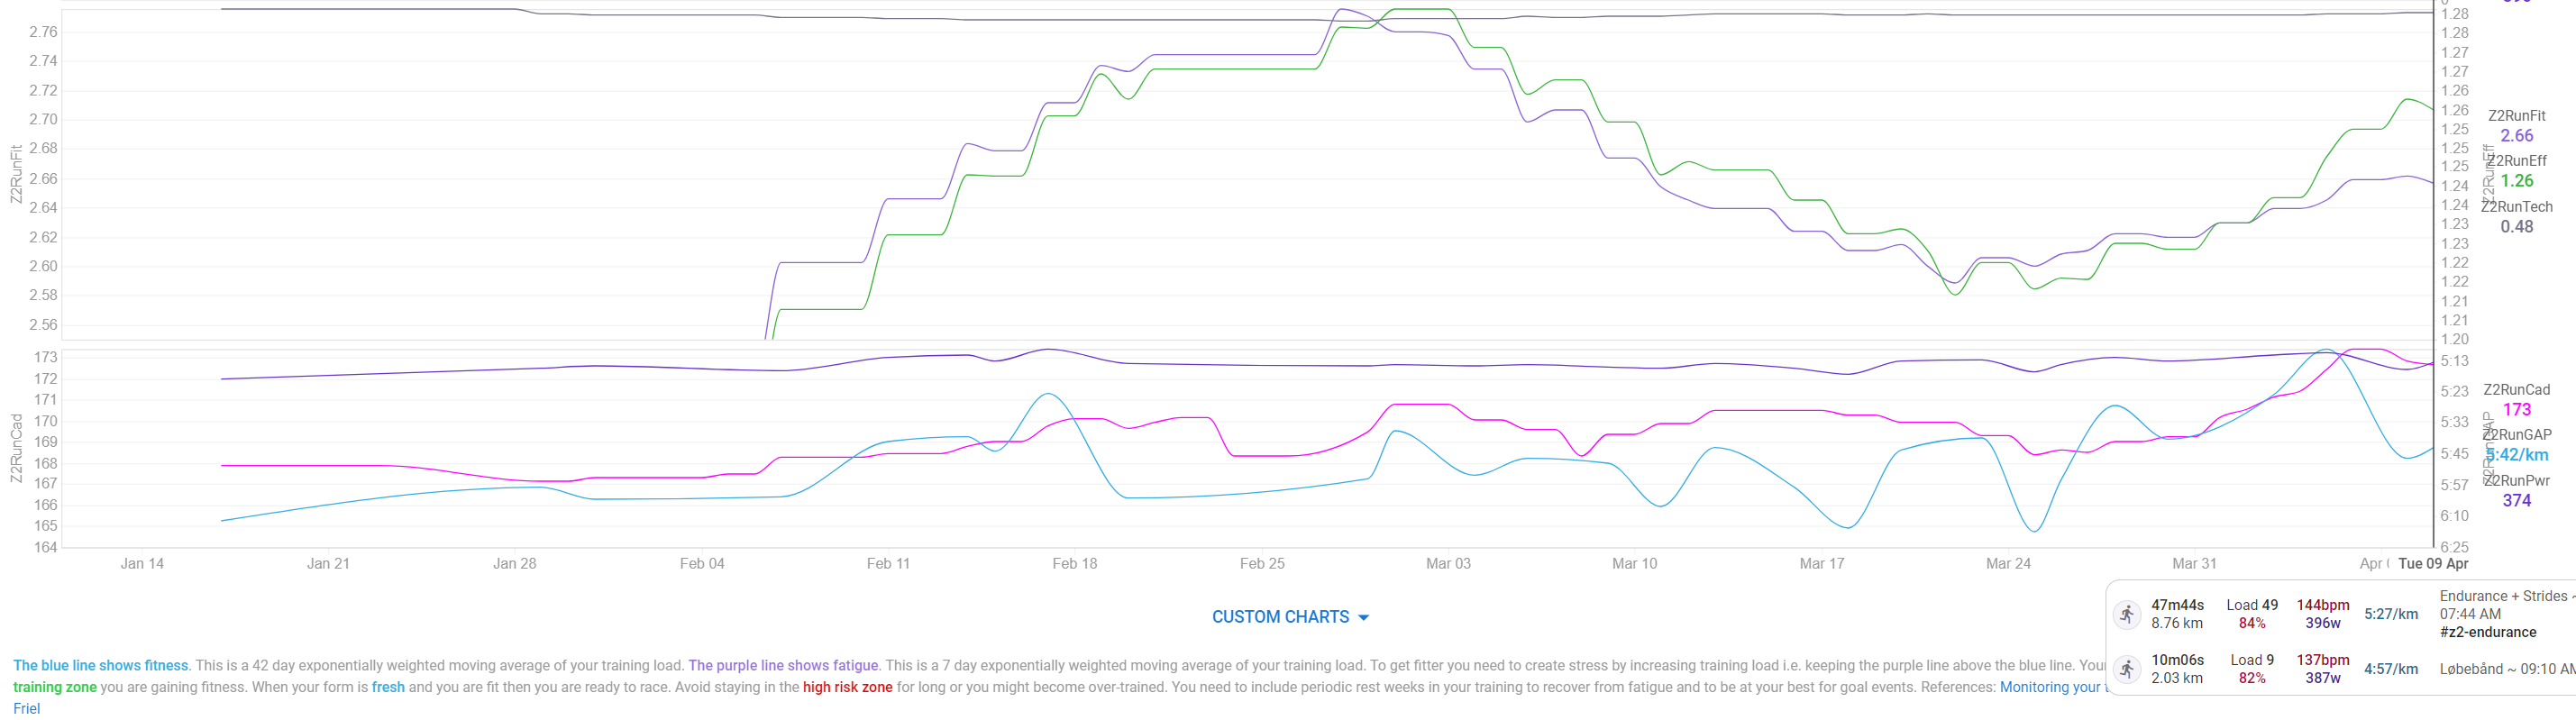
You can plot all Custom Field metrics on the fitness page to follow up on your performance.
You can modify these Custom fields to follow up on other Heartrate zones if you want. Just make sure to always set GAP, Power and HR ranges that represent steady state zones.
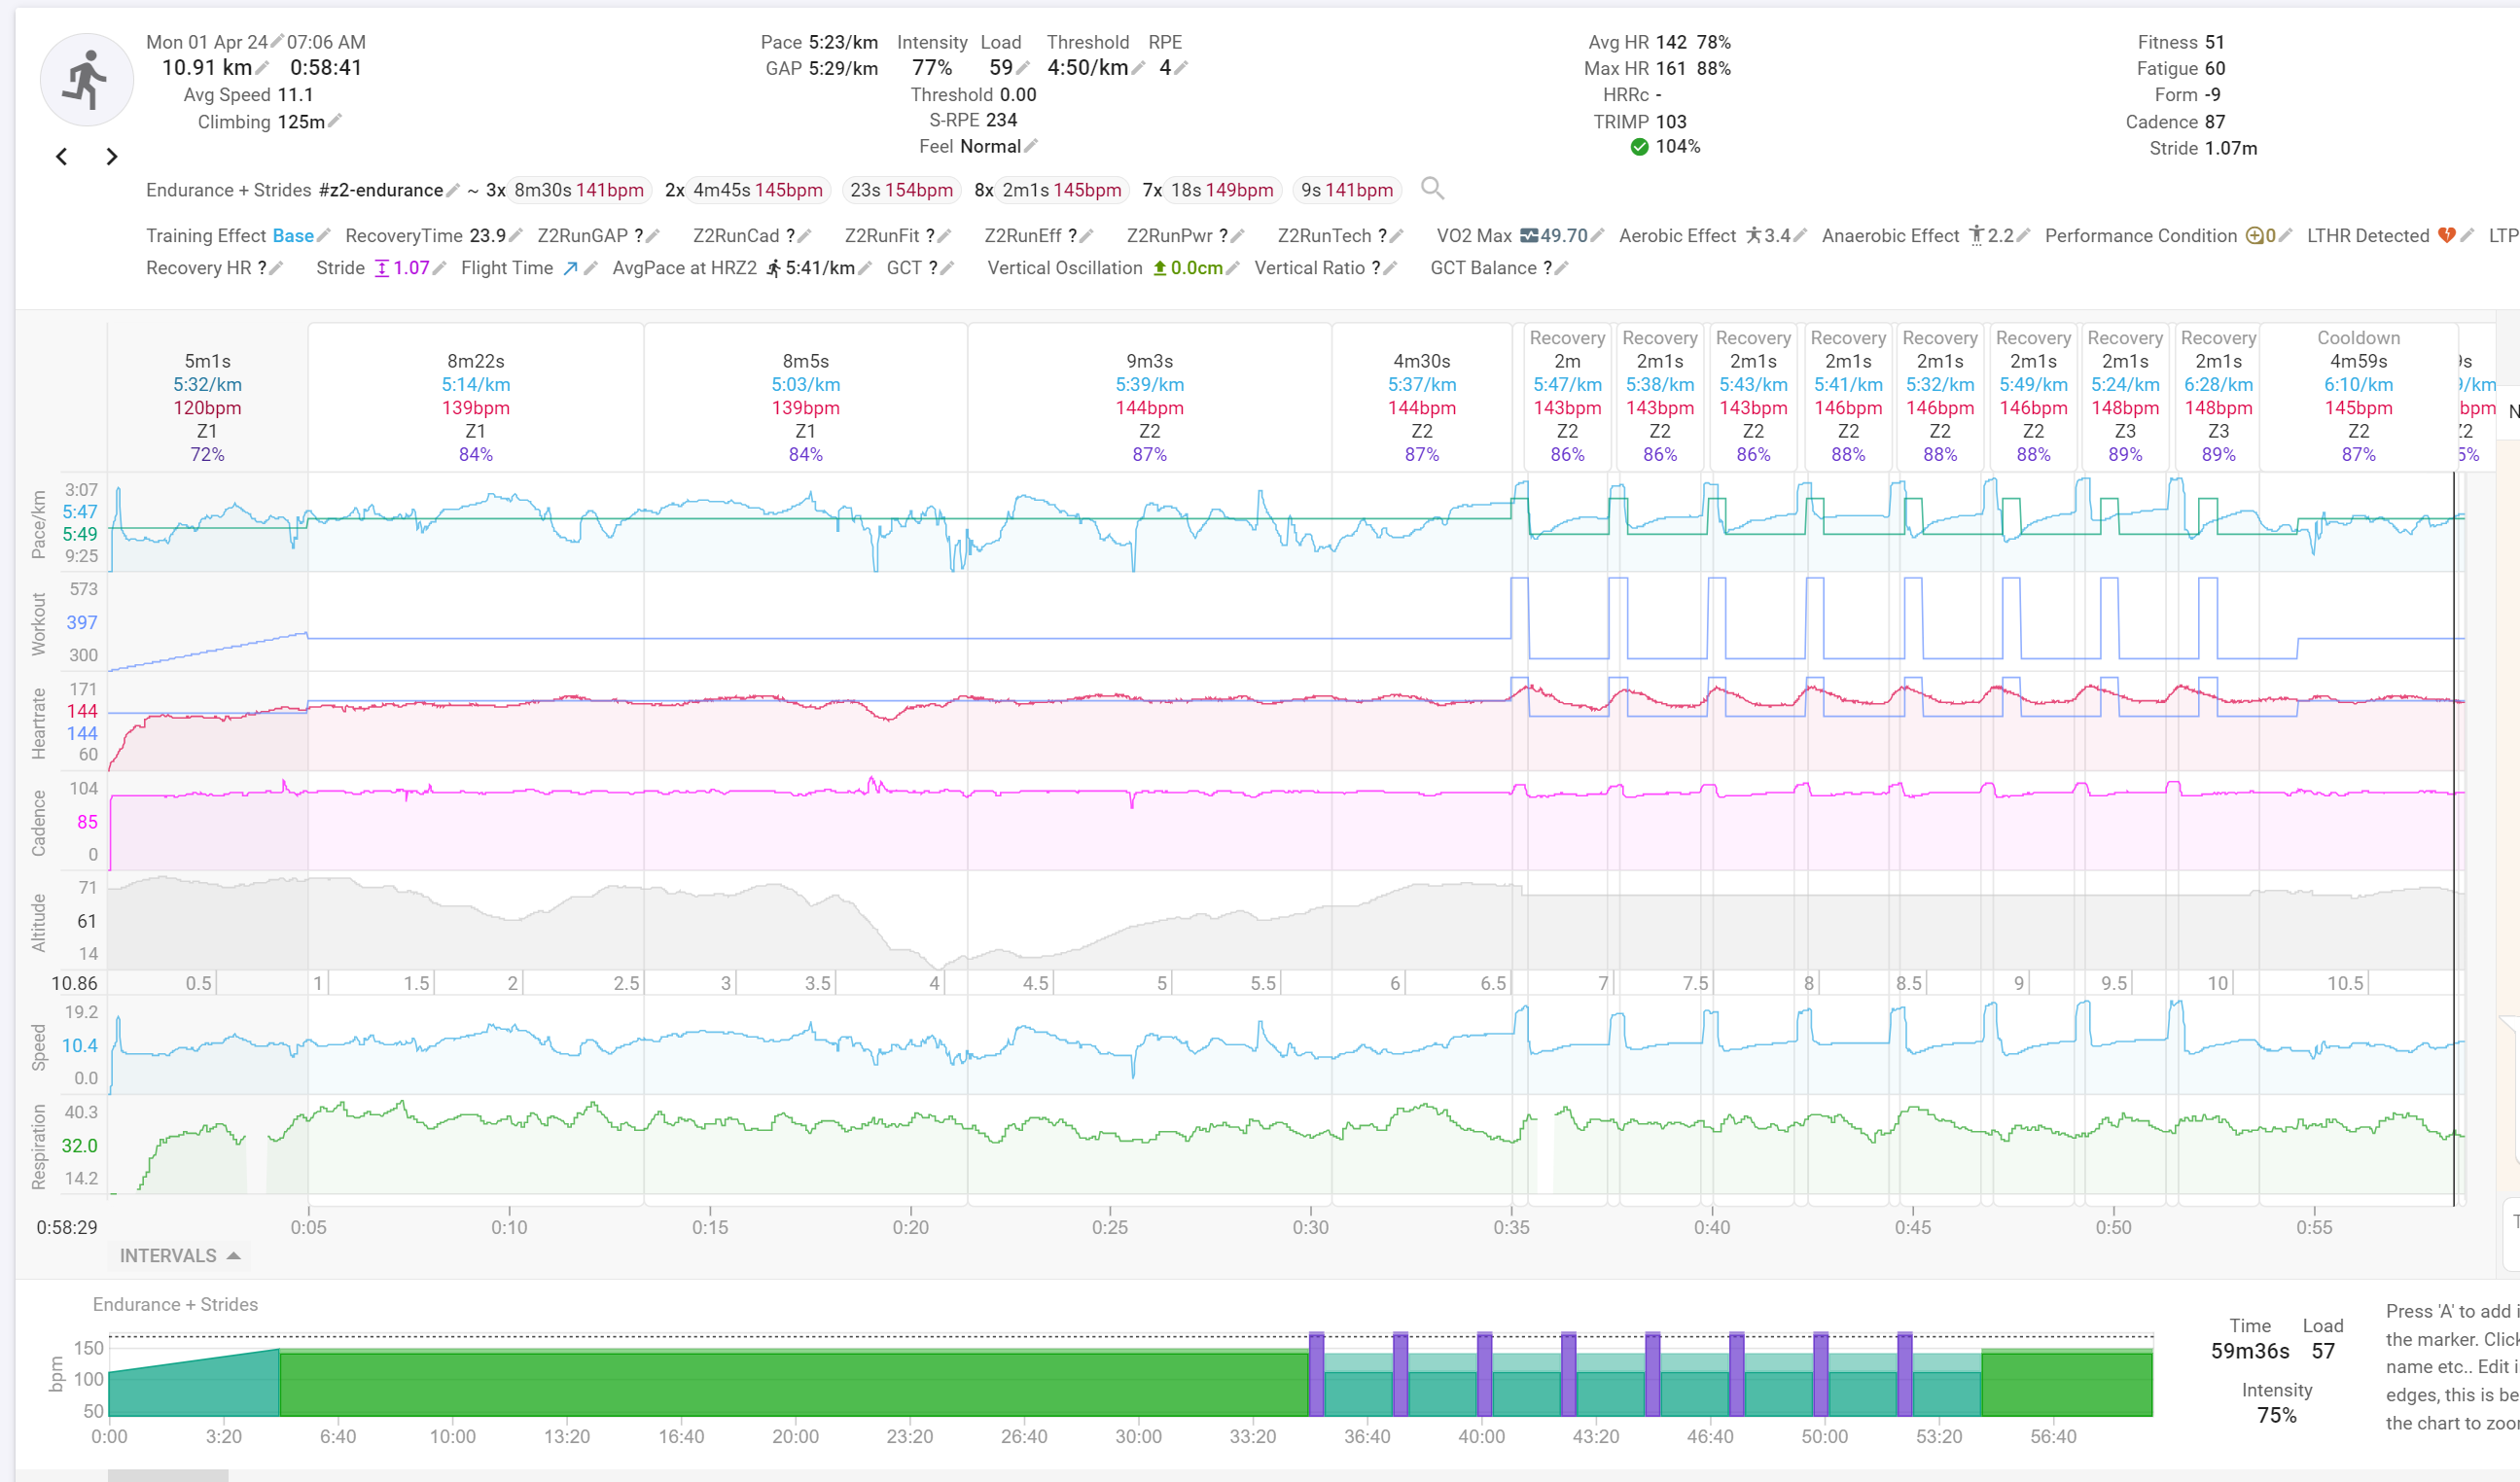
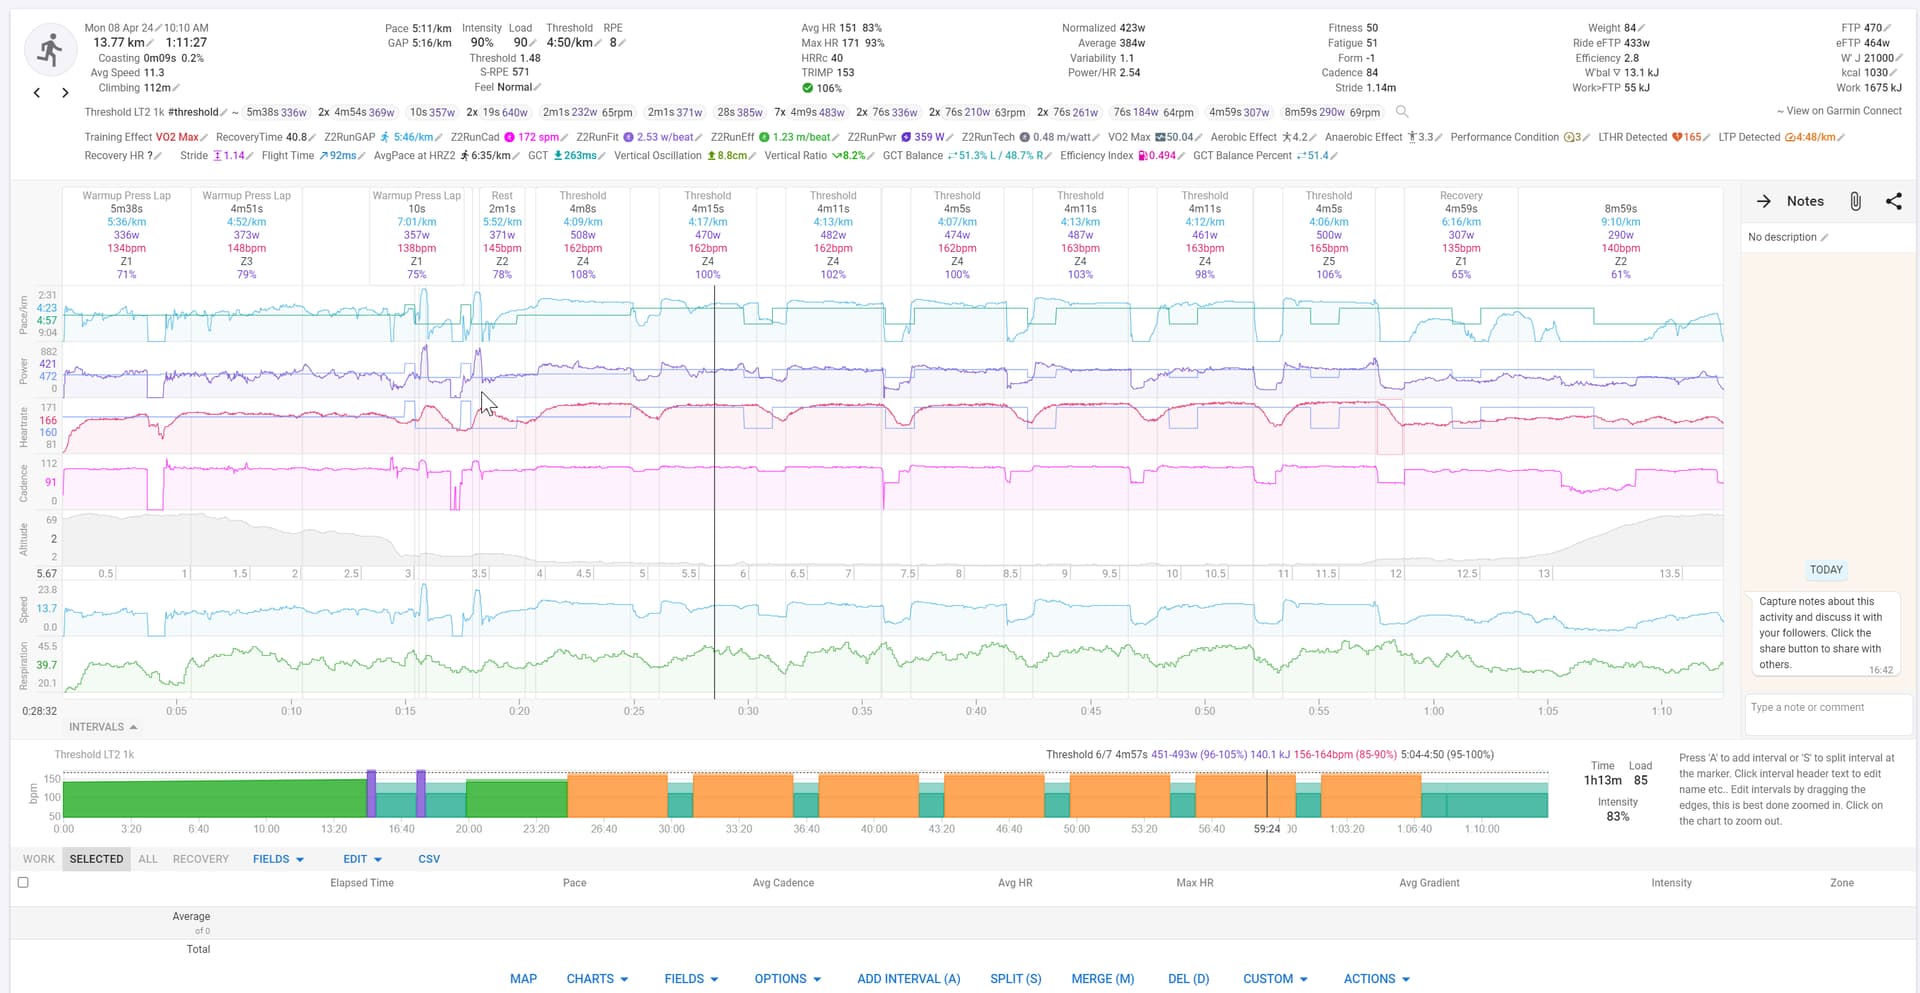
The easiest way to setup the different values is probably this:
Go for a steady state Z2 run at your chosen HR (I cap my hr for Z2 at 122bpm)
On analysis, set your target HR and range (example Target=119; Range=5 will take into account 114-124bpm)
Set Target Power and GAP to an estimate and set the range wide open (example Power Range=100 and GAP Range=180)
Now run the script and see what it returns for Z2RunPwr and Z2RunGAP. Use those averages as targets in the script and rerun the script.
Filtering outliers for GAP and Power gives you a more precise result because you discard:
HR anomalies
GAP errors due to bad GPS
Sudden accelerations where HR is lagging
etc.
It also isolates the Z2 part of a workout where you mixed in some efforts at higher intensity.
These values are all very slowly changing metrics. To see the changes on the graphs, you need to ‘zoom’ quite a lot.
I can’t just give you my exact setup because the numbers are quite different per athlete.
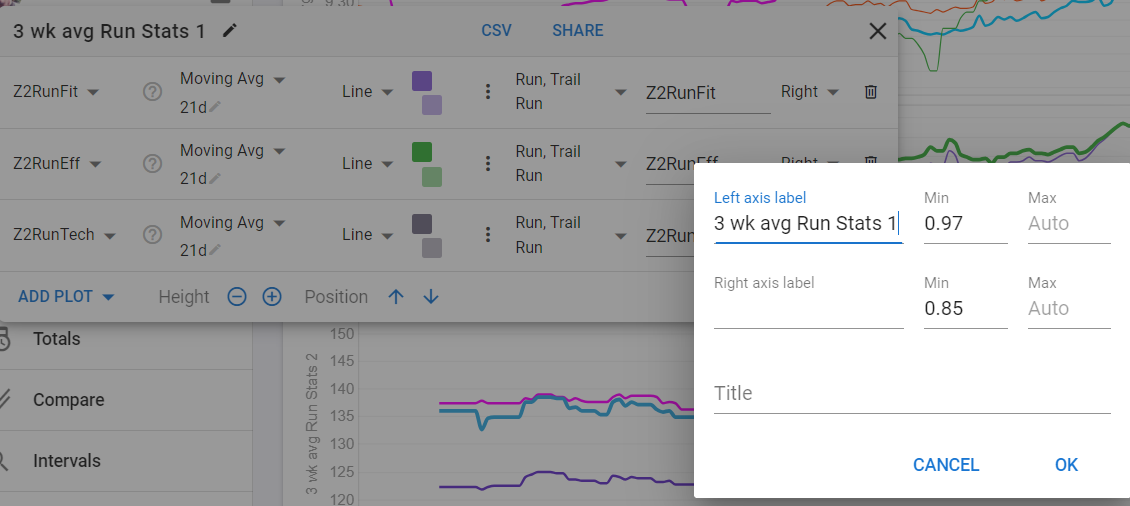
Best is to set only a minimum value for the axes and let the maximum auto adjust. You may have to switch the order of the metrics to get Fit and Tech on the left axis with a min of 0.48 while Eff then goes to the right axis with a min of 1.3 for example.
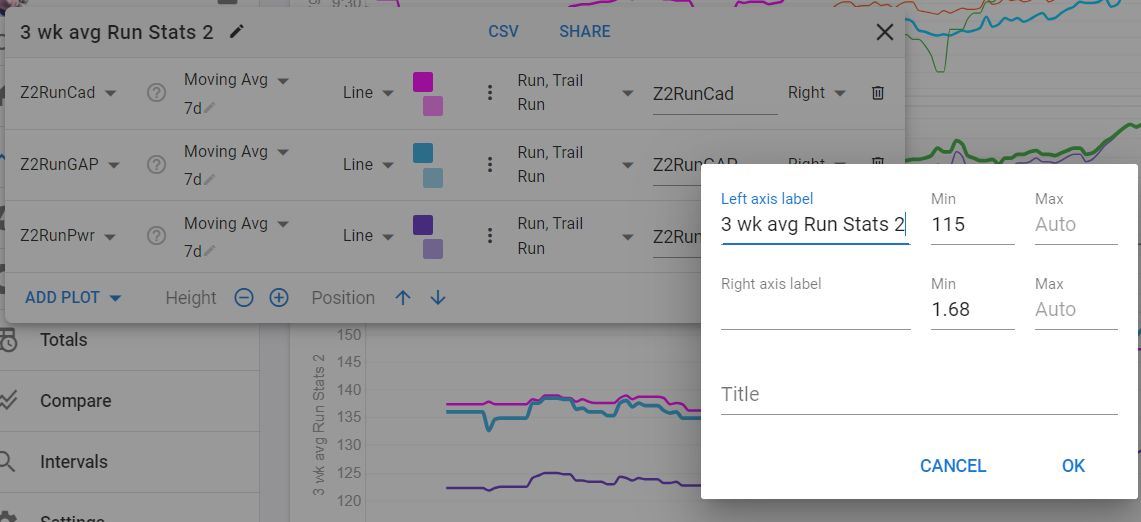
The second chart needs cadence and power on the same axis while GAP get’s the other axis with a minimum defined in m/sec.
It needs some fiddling to get a comprehensive view. You could also just plot only 2 metrics per chart, each with their own axis minimum, that should be easier to setup.
Is that caused by too wide zones (I left power and pace pretty open), or should I just ignore those in the graph (using a tag or something similar), or should they be included…