Thank you! Good idea re: cadence sensor. Added to the list.
You cannot yet ride “any workout” on the track but I will try to add this soon. Many have asked for it and it’s a good idea. Right now tracks have their own unique workouts.
Note that I recently went to a new “Stadium View” for the track experience instead of a typical 3D view that we had. Let me know what you think and if I should bring back the 3D “virtual wore” view too.
I snuck in a race yesterday without my AI coach being aware (currently ill & so only allowing me strict Z1-2).
The track view was excellent & it was really engaging. Lots of opportunity to alter the intensity v recovery time/laps in the Elimination race to ensure that I stood a fighting chance of recovering before the next Sprint lap. And the being able to choose the number of bots meant that I could tailor the race length to suit my time available.
So all in all far more enjoyable & practical for me than racing on e.g. Zwift, MyWhoosh. To me gameplay matters more than the graphics in that regard. Much the same as a VO2max workout also (especially if micro-managing the laps/bots) but with more variety/“spice” & so races will likely replace some of them. Just need Coach Watts to become a track cycling groupie now.
I am using Ride Cave for my structured workouts as well now.
Thanks for all your work, both Ben & the Cave Crew. Though I do five different discipline types, I will likely subscribe when fully recovered & able to increase my loads back up again. Not sure if Atlas & Coach Watts will play nicely though.
@David_Bannister your wish is coming true. I will be releasing a comprehensive new system that allows you to customize what’s displayed in your workout player. Here are the available metrics (below). You will be able to customize your view to your liking.
Anyone see anything missing that you’d like to see while riding?
Label
Description
Heart Rate
Live heart rate reading with session average
Average Heart Rate
Mean heart rate over the entire ride
Maximum Heart Rate
Highest heart rate recorded during the ride
Heart Rate Zone
Current heart rate training zone based on lactate threshold
Power to Heart Rate Ratio
Efficiency metric comparing power output to heart rate
Aerobic Decoupling
Drift between power and heart rate over time, available after 20 minutes
Cadence
Live pedaling cadence with target zone indicator
Average Cadence
Mean pedaling cadence over the entire ride
Torque
Pedal torque estimated from power and cadence
Speed
Virtual speed based on power output
Distance
Total virtual distance covered during the ride
Time Elapsed
Total time since the ride started
Time Remaining
Countdown of time left in the current workout
Average Power
Mean power output over the entire ride
Normalized Power
Weighted average power that accounts for intensity variability
Intensity Factor
Ratio of Normalized Power to FTP, indicating ride intensity
Training Load
Overall training load combining duration and intensity
Variability Index
Ratio of Normalized Power to average power, showing how steady your effort is
Watts per Kilogram
Power output relative to body weight
Normalized Power per Kilogram
Normalized Power relative to body weight
Percent of FTP
Current power expressed as a percentage of your FTP
5-Second Peak Power
Highest 5-second average power achieved during the ride
1-Minute Peak Power
Highest 1-minute average power achieved during the ride
5-Minute Peak Power
Highest 5-minute average power achieved during the ride
20-Minute Peak Power
Highest 20-minute average power achieved during the ride
W’bal Percentage
Remaining W’ anaerobic work capacity as a percentage
W’bal Energy
Remaining W’ anaerobic work capacity in kilojoules
Time to Exhaustion
Estimated time until W’ anaerobic reserves are depleted at current effort
Power Zone
Current power training zone based on your FTP
Interval Delta
Compares your current interval averages to the previous interval
Interval Avg Power
Average power output for the current interval
Current Interval
Power zone, target watts, and duration of the current interval
Next Interval
Power zone, target watts, and duration of the upcoming interval
Live Power Chart
Scrolling power chart showing recent output with workout intervals
Workout Overview Chart
Bird’s-eye view of the entire workout with power trace
Power Controls
Live power reading with zone gauge and FTP adjustment controls
W’bal Gauge
Semicircular gauge showing remaining W’ anaerobic work capacity
Interval Trends
Line chart showing power, HR, and cadence trends across intervals
Looks great but now you have me very nervous about how small you are going to make those fonts again!
Seriously though they are pretty comprehensive & I would be amazed if any other platforms could matach them. One idea is perhaps to have pre-selected combinations as this level of choice might be too much for newbies or not applicable to the type of race/workout that is being done. So if e.g. doing a race hitting a " energy reserve metrics" button with metrics including W’ Bal & Time To Exhaustion would be great. But if doing a steady state then efficiency & variability would be more appropriate. Having pre-selcted groups would potentally save having to select/deselect various ones before a workout starts?
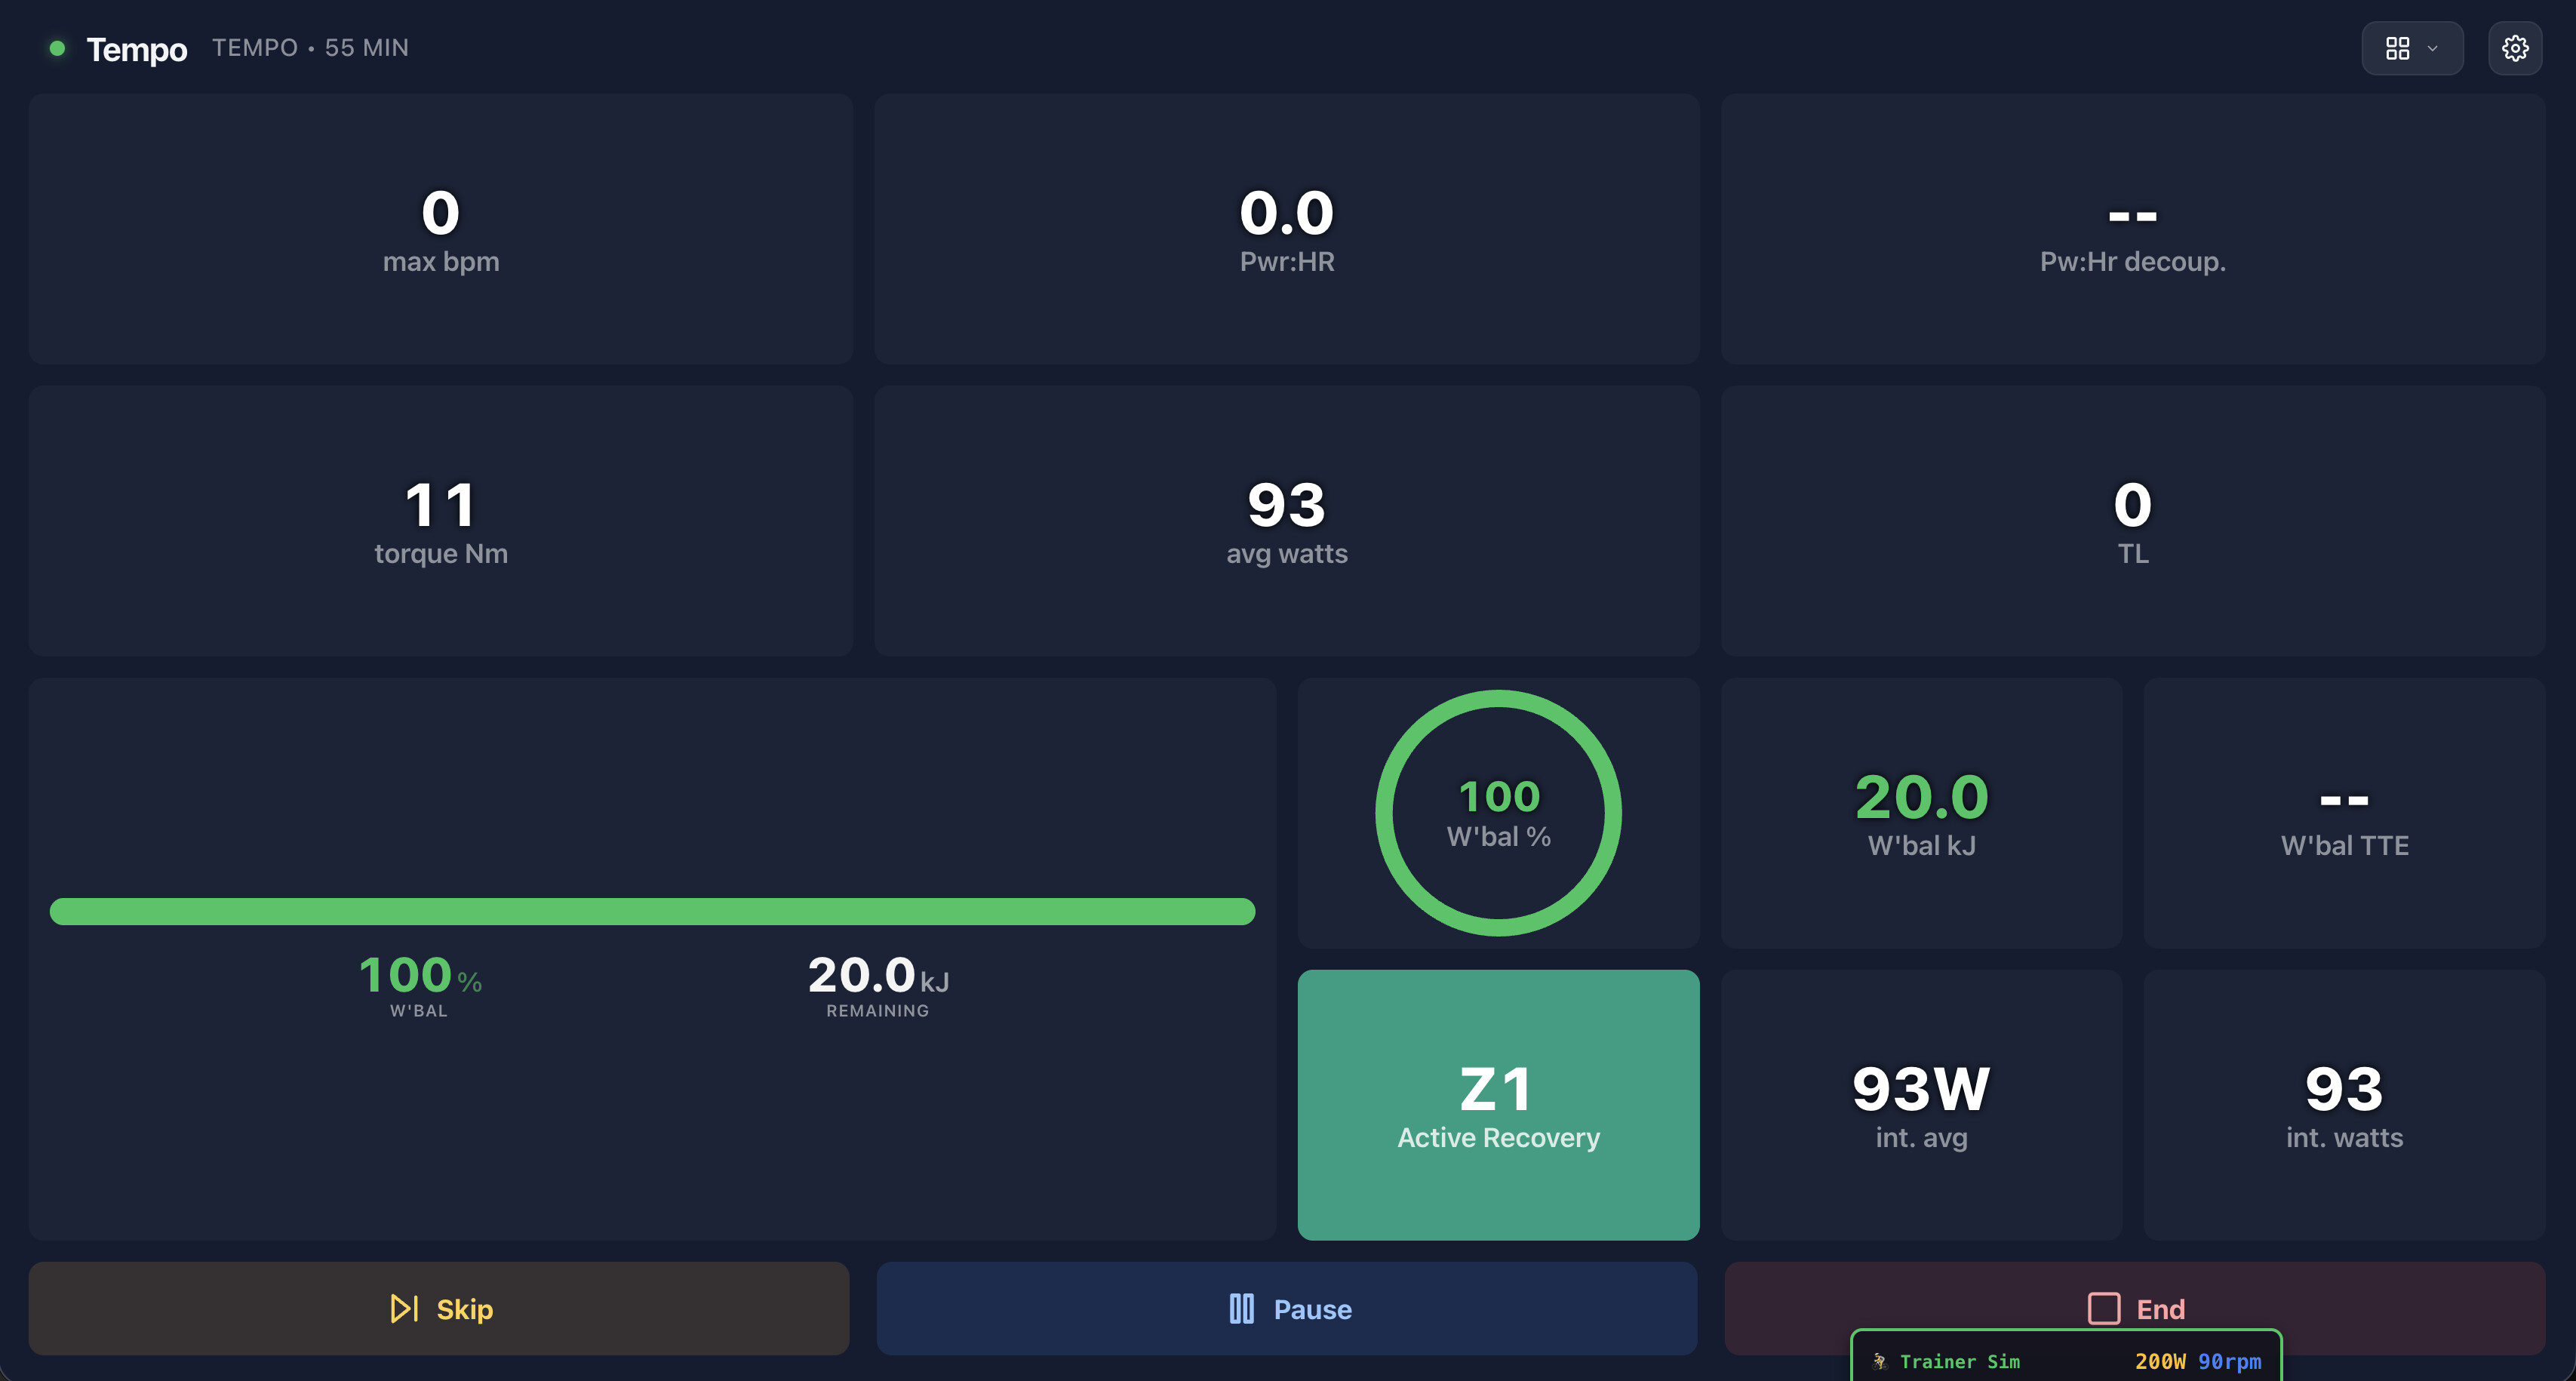
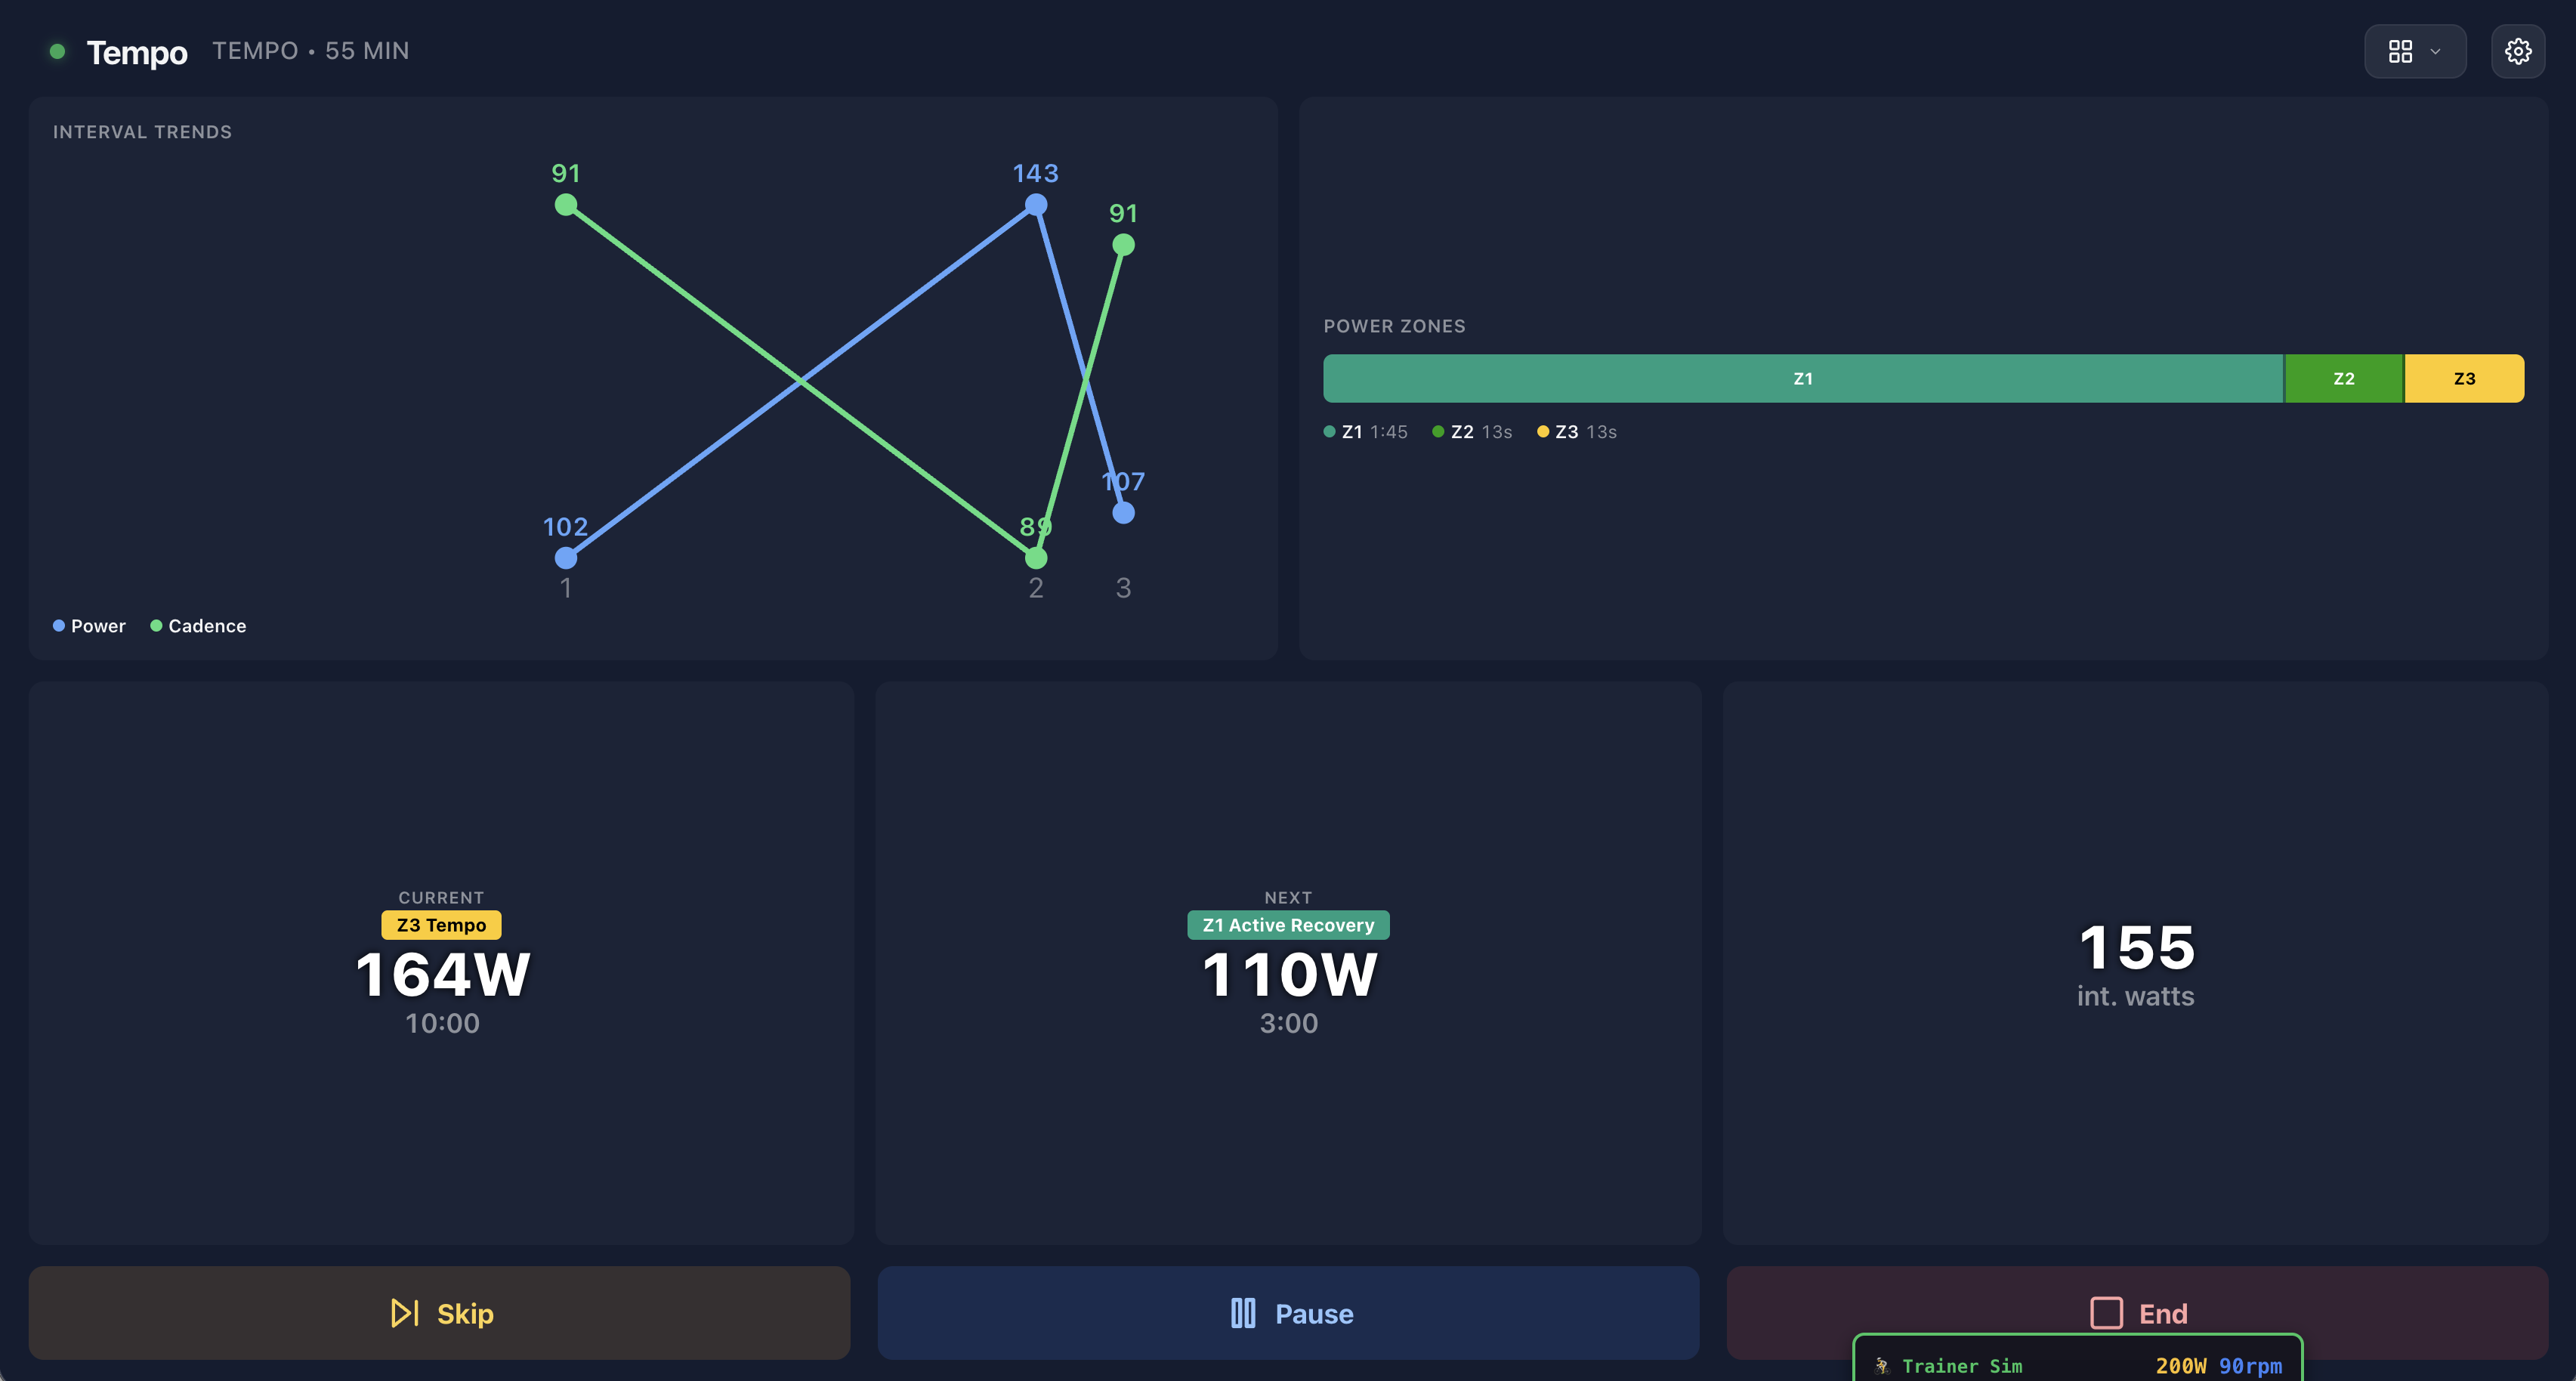
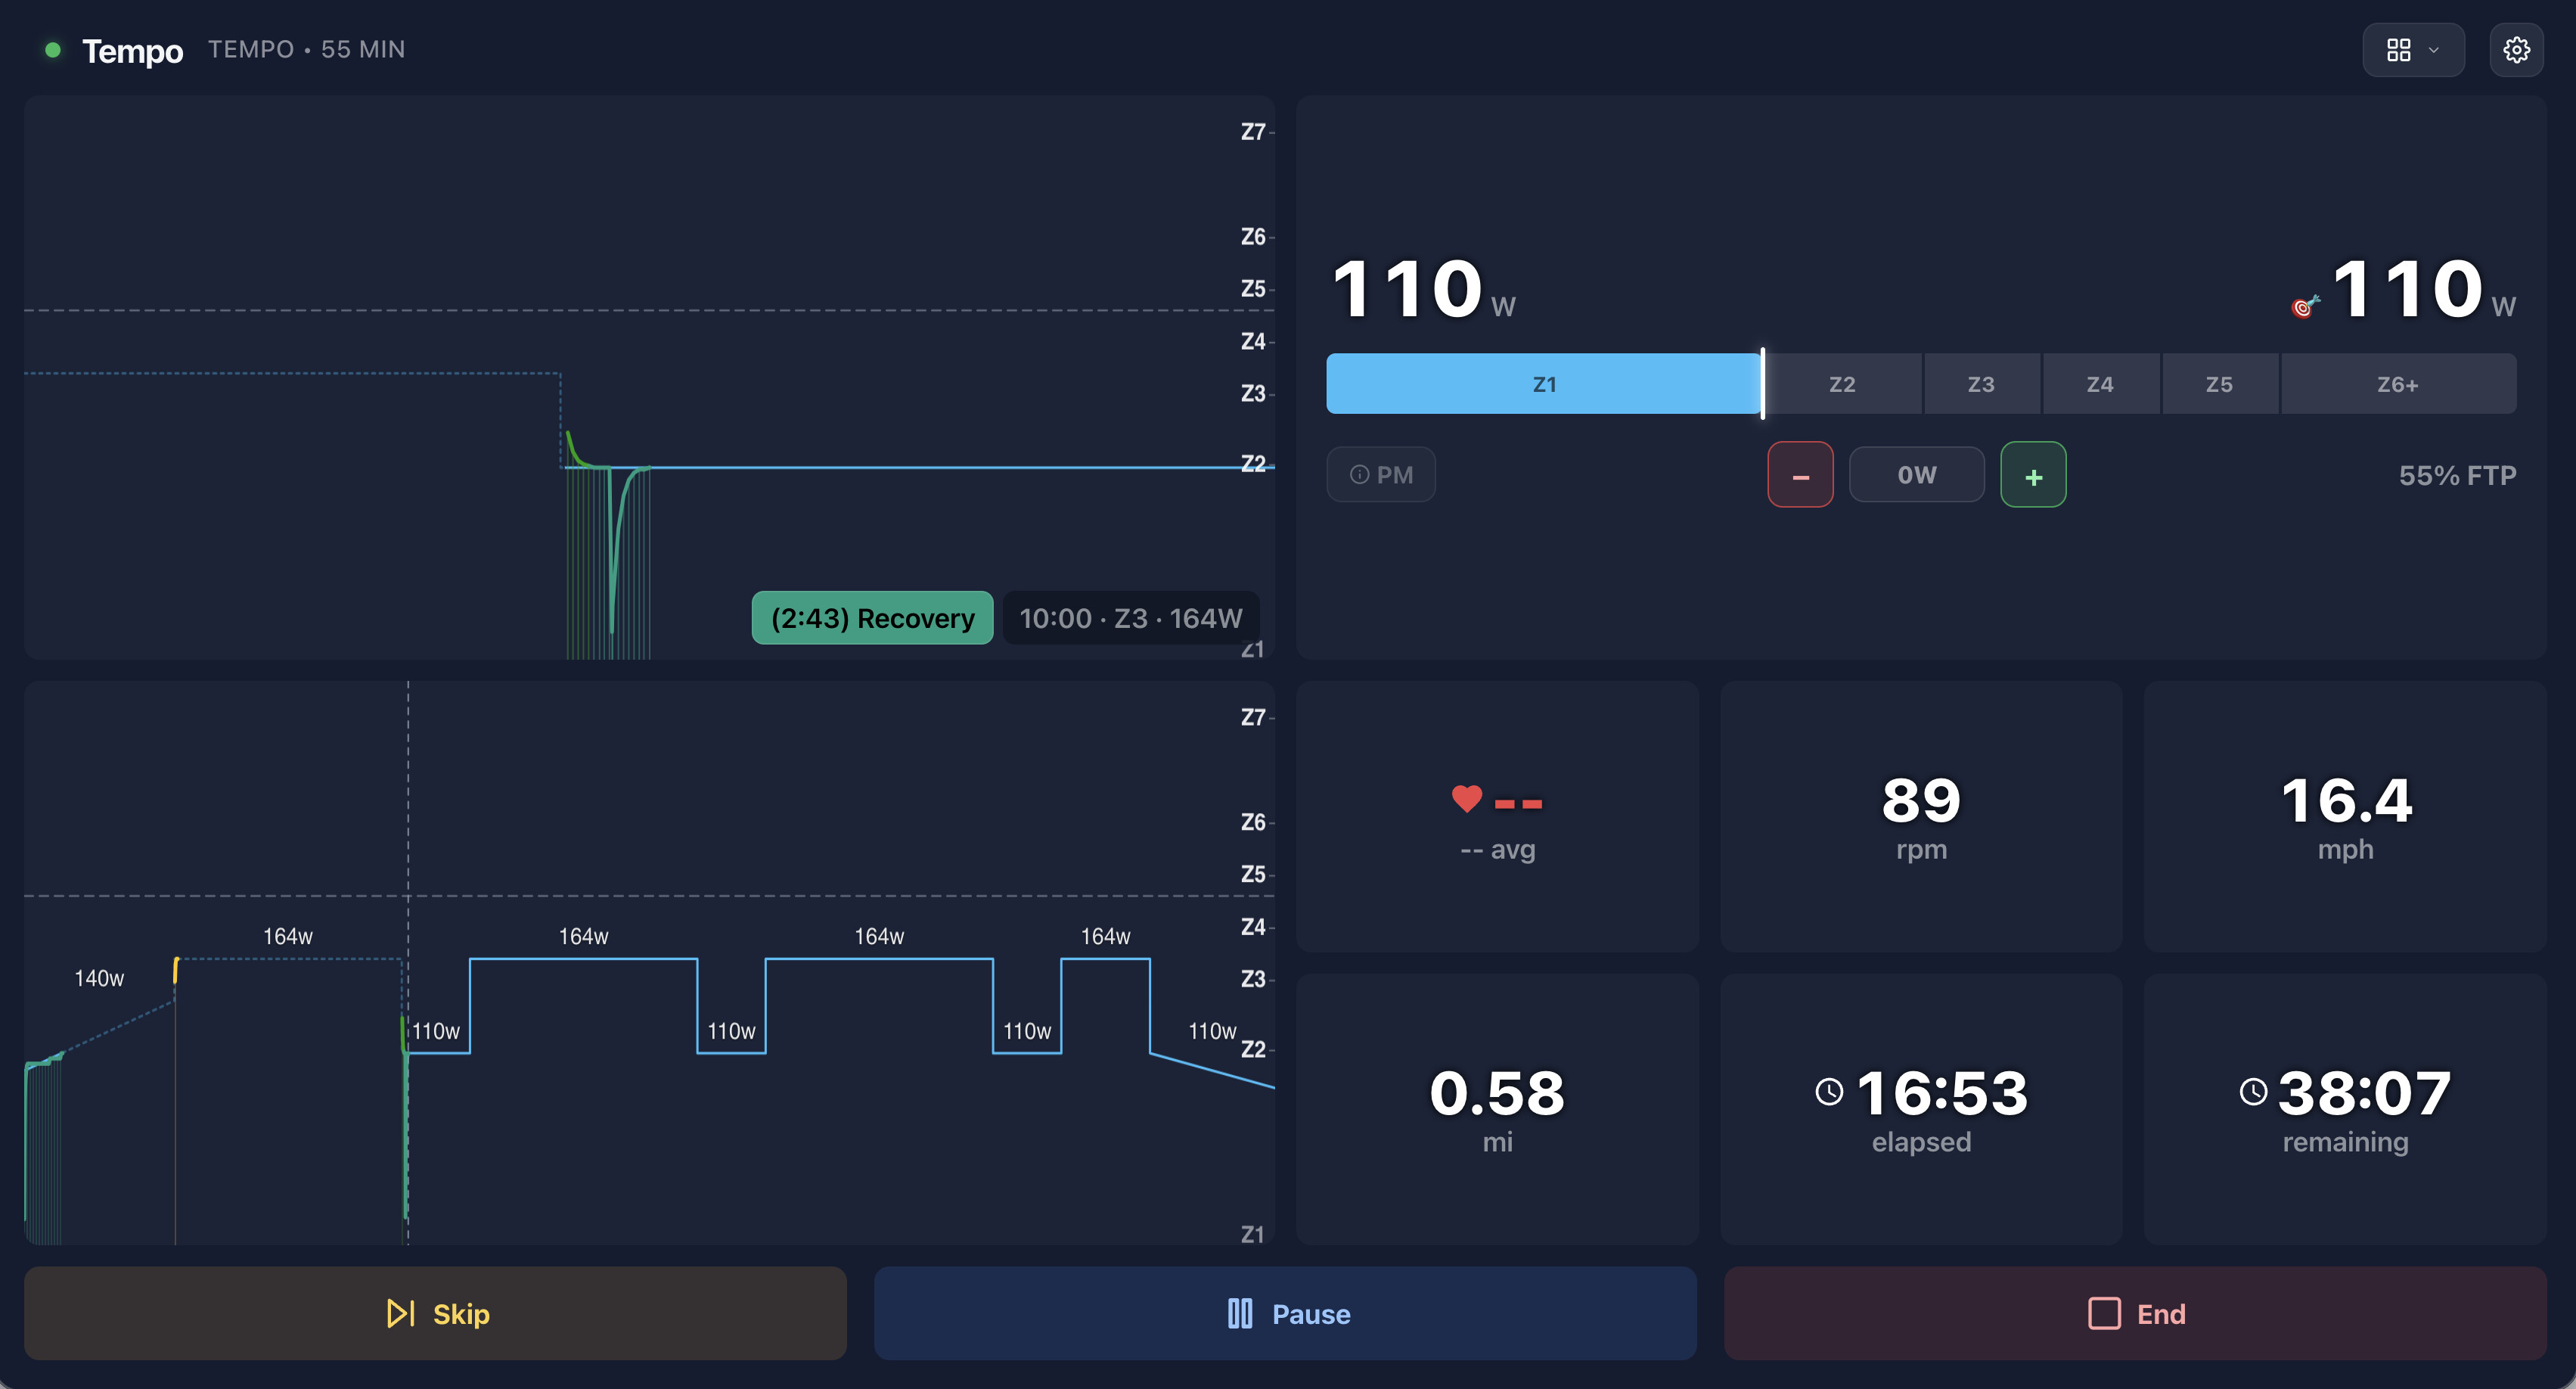
Haha still large font sizes! Some previews below (WIP, but shows the variety of layouts). It will be highly customizable - any configuration and any type of data combinations. And yes it will have pre-defined templates as you’ve described
Those look great for workouts. So somewhere on the screen you could perhaps place e.g. 3 buttons that I could press to quick cycle through the (user customised) combinations if I wanted to. That would mean that you would not need the whole screen for metrics as in the first view but could use half as in the last one. And for example if you have a long interval set, the comparison to the last one is only needed for a quick check & then swap to another view; whereas with 30/30s you might want to leave that intervals comparison combo on screen until the end of the set. Somebody is also bound to ask for a Spotfiy tile at some point which again could be temporary i.e. just when e.g. the song changes over to the next one rather than taking up a permanaent space necessarily.
Is there a way to do this for races though as the central portion, though having blank space needs it presumably for the isometric track. Presumably it would need to replace one of the side panels? Another idea could be to have the top metrics changeable as Intervals does with their “header panels”. So for example in a race where I would be pedalling like a juiced up hamster, the RPM, distance ridden & speed might be noise, relativel to other things at least. I would be perhaps be more focussed on the radar at the bottom (for position/gaps.surges by others) & perhaps W’ Bal/Time To Exhaustion. So I could choose to have that “internal battery panel” instead of your current speed/rpm metrics?
I wonder if you can add support for Xert “magic buckets”-like data - XSS with peak, high and low components… Since Intervals support calculating these on the activity, it may make your tool an alternative player for Xert users…
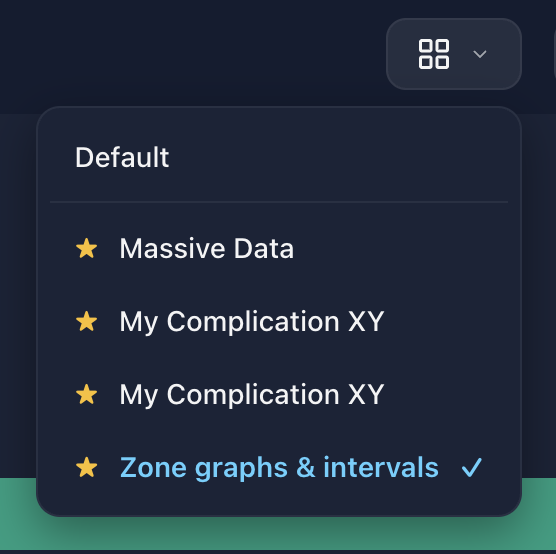
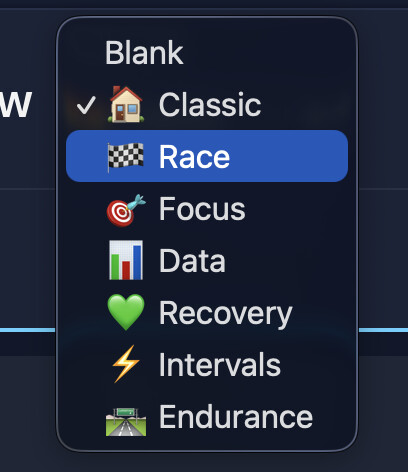
@David_Bannister the way Ride Cave will handle view switching like that is with a view switcher in the workout view (below). You would create different views for different purposes that you can either set and forget or switch in real time based on what you need. You might create different ones for different situations and there are a set of default templates to choose from (also below) but the customization is infinite.
@DGCom I love that idea, I’ll add Xert to the near term roadmap. It will require importing power data from intervals (and enabling users who don’t use intervals to set that data in settings) - so not quick add but a fast follow.
I managed to get Xert style modules AND a mini-track view in the release. This will be live tomorrow morning (silent release for production testing) before broader announcement this weekend.
I believe this is the single biggest innovation to Ride Cave since it was launched. Though that might just be my excitement speaking
@Ben_Snyder I was looking at the web app and noticed that some dropdowns show with white on white text - in Chrome-based browsers, but are ok in Firefox, example:
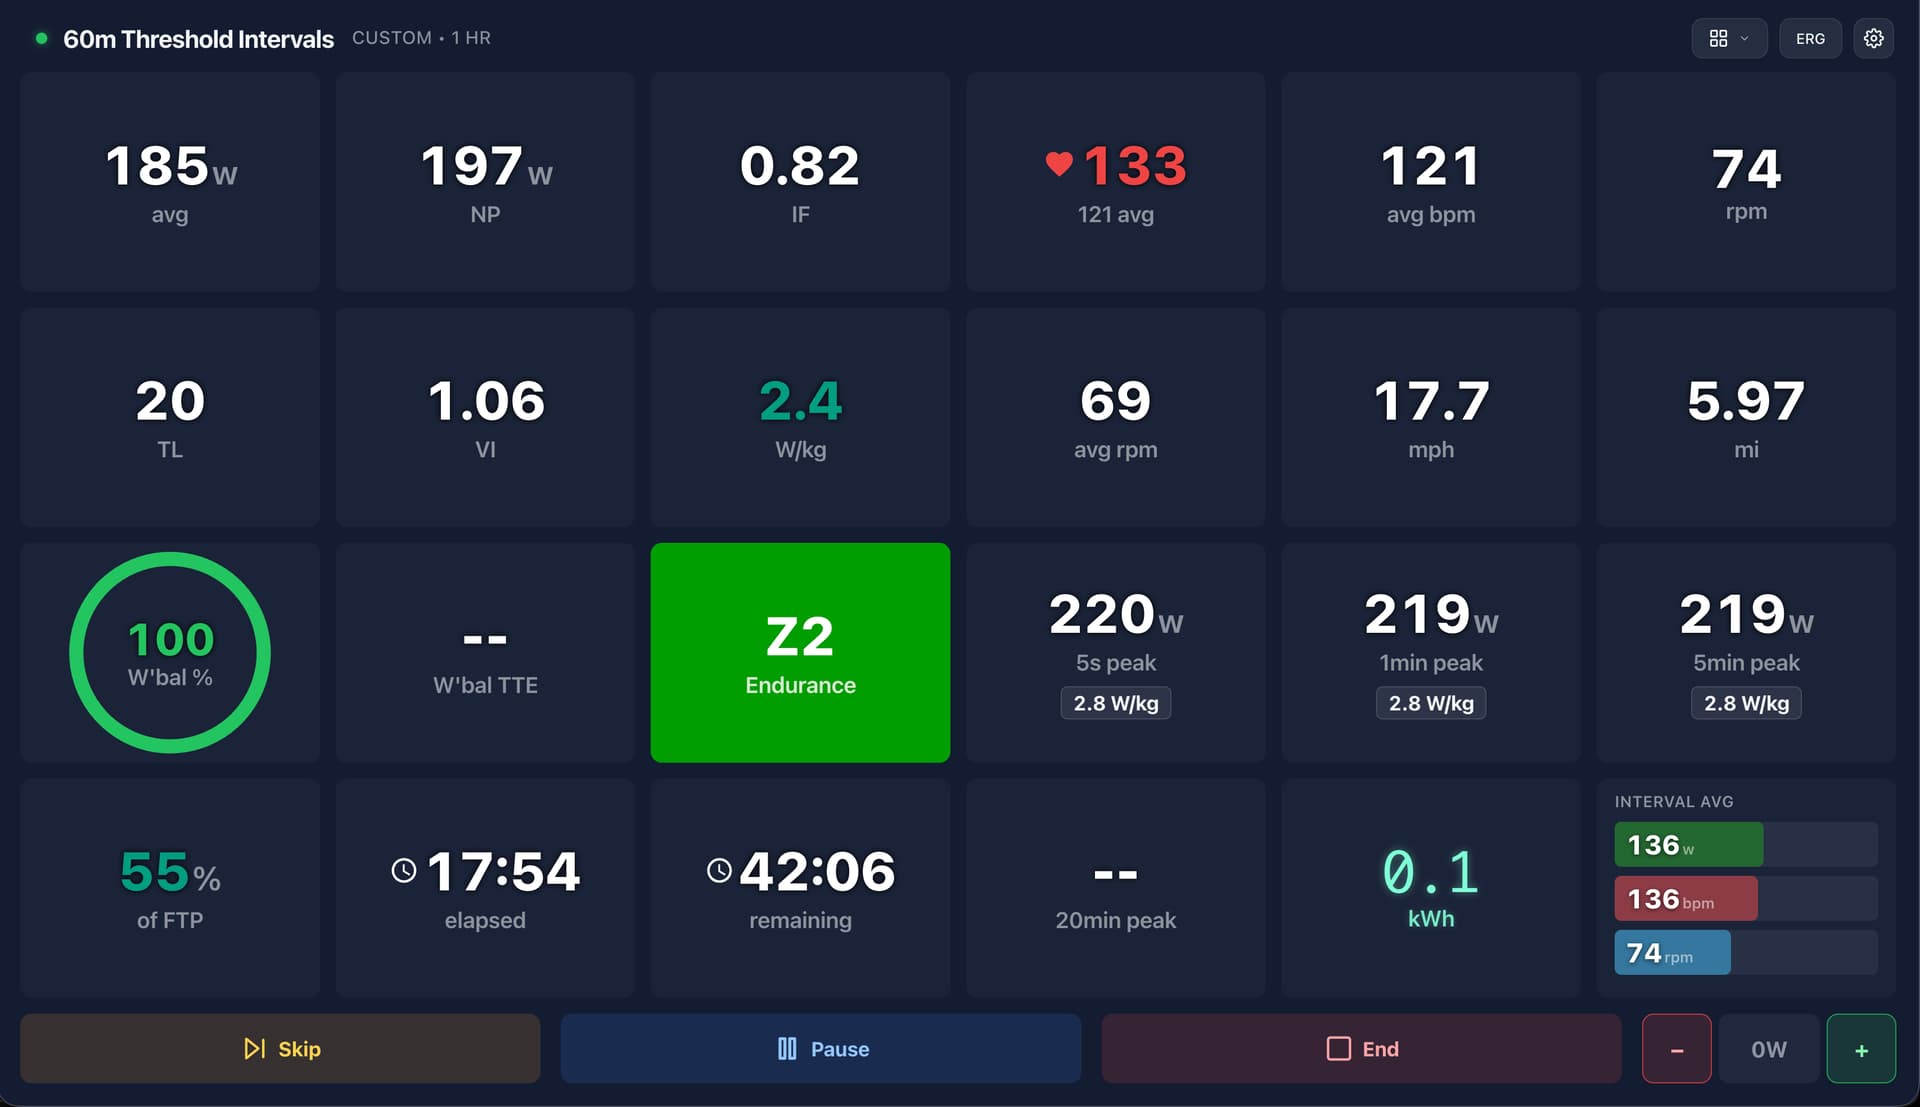
Views are live. 40+ new data fields and infinite customization. Xert-style strain, W’ and so much more. Below is the view I’m riding as I type this. More info and a demo here Loading... | Ride Cave
I will try it out tomorrow. It looks great though. I presume that you missed the lecture on “managing customer expectations” as you have just given us the whole sweetshop . I just hope that your shoulders are broad enough for what complex feature requests we can dream upin the future to keep you challenged.
I tried Ride Cave today and must say I really like the look & feel of the app. Everything worked as intended and I did a workout synched from intervals. I just did 2 minutes on one of the tracks and am looking forward to test this more thouroughly. I think this can be a lot of fun.
Some comments:
I use the app on an Android device, which uses gestures to navigate back & forth. I noticed that if I “swipe back”, instead of getting to the prior screen, I exit the app. That might be something to change for future versions.
It would be really great to get more freedom in the custom view editor. I’d like to mix graphs and KPIs on one creen (e.g. live power Chart on top third of the screen with a 2x3 matrix of fields below, or Live Power chart, Power Workout overview with a 1x3 matrix, …).
I noticed that you want to build workouts from courses, which I really like. Please think about adding courses the way you added Tracks. You could provide a preset of iconic courses (e.g. iconic climbs) for everyone to chose from (incl. community records, bots, ghost riders etc.). Plus I’d like to see the GPS plot in the fit file. I know this triggers quite some people, but I think it just boosts motivation.
Will post more after more testing. Keep up the great work!
Challenge accepted. Here goes. I think that it would qualify as a USP for Ride Cave until the other platforms copy it anyway.
So a potential screen to help maximise the benefits of recovery rides i.e. Z1 or easy Z2 rides where recovery, efficiency or reducing any aerobic decoupling are the aim.
The Biohack or Biofeedback view. It could be used to facilitate a workout potentially called “Zen & The Art of PNS Maintenance”, where the aim is to stabilise or improve the “rest & digest” part of the nervous system. The aim here is to maintain a steady power target & reduce the HR/breathing rate as the ride progresses.
Or another workout “Conscious Decoupling” where the aim is to maintain a steady HR but tweak the power up gradually.
The screen/view elements would be a power gauge with microincrements (1-2W probably) pre-populated to your Z1-2 threshold or your Z2-3 threshold minus e.g. 5% (wriggle room to ensure you stay within that Z1 or Z2 area (or section of the intensity continuum for those who do not recognise hard zone boundaries). So aiming to avoid cardiac drift or creep.
You would have HR which could be pre-populated if you were maintaining steady HR e.g. Maffetone test. Or it would read live/current HR. The idea in that case would be for the HR gauge/indicator to gradually reduce target HR as the ride progressed, trying to employ biofeedback entrainment to lower your HR in sympathy via resonance. So this could be photic via a strobe effect from either the whole screen or perhaps just the HR tile. In theory your HR would hopefully then start to reduce & hit the strobe frequency. Or it could be auditory, be that a simulated heart beat or using music, so perhaps Spotify play list, or e.g. binaural beat type rhythms).
Next tile would be breathing rate (BR). Again the breathing rate gauge could be pre-populated by e.g. Atlas or user-set & then would automatically reduce with duration or be user controlled e.g. if doing a Z2+ ride rather than Z1 & so trying to maintain BR rather than reduce it. This tile could then have phased colouring to represent inspiration v expiration. it could also potentially have preset breathing patterns if people wanted & were doing a really easy Z1 ride.
Another tile that could be useful would be a HRV graph or gauge for those with a suitable chest HRM. This would show any incremental improvement in HRV & so positive effect of the biofeedback. To really blow my socks off a DFAa1 graph could be included so that it can help to confirm refute the aerobic threshold boundary (though this is still not settled science). But perhaps pushing my luck with that one? But you did goad me.
Then after the ride (which would have e.g. a Zen tag for easy future comparisons) a post ride briefing with Atlas to analyse how it all went, compare it with your last Zen (tagged) ride(s) & schedule/tweak presets/goals for the next Zen Workout.
As I have mentioned to you privately, your app has awoken my previous latent but now wannabe track racer, & so I would like a race craft teaching & support system from Atlas. I know that this is a way off as it would require the Atlas Live etc; but perhaps outing my thoughts on here might assess if I others would also value it. it would be like Duolingo did for chess. To paraphrase their blog post. Our new Track Racing course will have you thinking five laps ahead. That’s right… we just added Atlas Race Coach & Live Assist! Start from Cat 4 (square one) with Atlas as your coach & race engineer.
So some of that could be a theory course that would essentially be blog post type. That would introduce new racers to the concept, structure & tactics of track cycling. Then these would be interspersed with demo races where Atlas would structure a race so as to demonstrate the particular element that the blog post was teaching/stressing. Atlas would also potentially tweak your calendar workouts/Plan to hone racing skills e.g. sprint timing & gearing, or e.g. durability.
So during a race, be it real or training a skill, a new view could be to have a “pit wall” tile similar to F1 TV coverage perhaps where Atlas, my “race engineer” or coach, can relay pertinent facts during the race. This can be in the form of teaching skills or tactical advice at different levels for a real/live race that a user sets up. So this tactical advice could be from maximal help if Easy setting is chosen, limited hints for medium setting & none/off for Hard.
So the sort of information that I am thinking I would value as a newbie in the maximal category could be gaps to other riders & who I need to monitor most closely i.e. who is most likely to put on the next spurt (as Atlas can consult the “Form Book”) & how aggressive that rider might be; so for example how big a gap should I build over that rider to allow for their next sprint & when best to press the trigger. Based on my W’ Bal & knowing my peak power over a few short durations Atlas can then suggest a couple of strategies to consider for other threats also or to manage my energy reserves to the end of the race. These can perhaps have been outlined in a pre-race strategy meeting/tutorial so that I know what “switch to Plan B” actually means.
To make space for this screen, although now you have cracked voice it could also be voice, I was thinking that the left hand of the screen, i.e. relative positions to others with the gaps, could be moved to the radar at the bottom. So the person behind can be shown with the time gap squeezed in between the two avatars. And the same with the gap to the leader, if that is not me. The rest of the gaps will be evident from the track avatars & any imminent threats can be identified by Atlas in a message or voice chat. Having the long list of all the riders is not important to me, especially as a newbie as my focus/awareness is likely to be just one or two of them. Plus it might also get rid of those indecipherable small fonts for the timing gaps once & all.
I will leave it at that for now as my Muse has bonked.