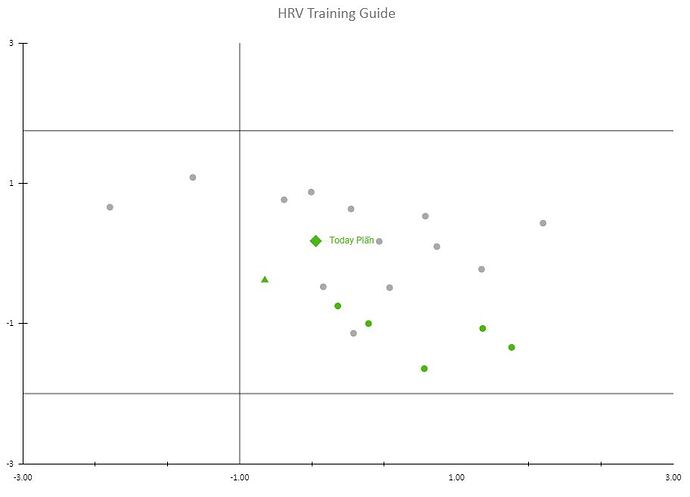
Office has no standard way of changing the text on hovering over a chart element. The only way to change that text, is to use ‘vba’.
I may do that eventually, but right now, I’m somewhat saturated by all the new programming stuff. Office, Power Query, API, cURL, batch files… I’ve done so much stuff that is new to me during the last month, that I need a bit of rest to my mind  .
.
And to be clear, I’m super grateful that you have taken the time to learn all that stuff and made this spreadsheet possible. The label thing is clearly a very, very low priority thought. If anything, eliminating errors and increasing user friendliness are clearly more significant. 
100% It’s just info to be used with all other info to help inform decision making. 
So I’ve been playing around with the Google Sheets version over the weekend - this works better for me as you can refresh data via the web version which I don’t think it possible with the Excel Power Query version. There doesn’t seem to be a way to colour the zones, so I have had to stick to colouring and changing the shape of the points.
I have made other tweaks for my own use, but can share if it helps.
Welcome to the “Dev team”… your assistance will be appreciated
 thanks
Here is a copy of the Spreadsheet I modified. Athlete ID and API Key need to be entered into cells the HRV_calc sheet (personally then hide this sheet). I removed the refresh/update button as I had set the script to run whenever the sheet is opened. You can manually refresh the data by going Extensions/Macros/importIntervalsICU.
Planned to use this mainly on mobile, therefore the chart to its own tab and formatted a summary info “page” giving today and yesterdays results.
Not taking any credit for this, as I’ve simply modified the Excel and GS provided by others to meet my own needs.
Good job! 
Looks like a really nice start. Sync worked right away.
Hopefully someone is able to improve the graph.
I would love to get access !
Thanks, credit is where credit is due.
Isn’t that the objective of “open source” stuff? To let collaborators help to improve it.
The Google sheet link above is active for everyone. Just save your own copy of it and work your magic 
Make sure to share your work!
Super cool. So easy. Thanks!
Two edits I made for readabilty:
-
Change the date format on ‘HRV_calc’:
=IF(ISBLANK(Wellness!$B4),NA(),CONCATENATE(MONTH(Wellness!$B4),"/",DAY(Wellness!$B4))) -
Add custom labels to Data series 6, 10, 11 & 13 on ‘HRV Guide’ in order to see the dates:
HRV_calc!AA4:AA60
This is giving me a ‘view only’ option on mobile. Won’t let me edit to input athlete id or API?
Save your own copy!
As MedTechCD has said, save a copy. If everyone uses the same file you won’t get meaningful info as it will change.
I did that. Hmmm. I’ll download again and try again.
Edti - Ah. I downloaded to device but never actually ‘saved a copy’
Thanks folks!
Question (probably, but not necessarily, for a coach that reads) regards defining light intensity training ;
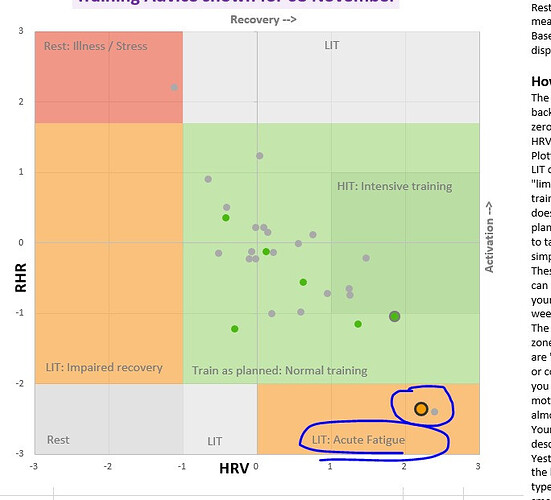
I have a planned session for today with an IF of 0.76. The session does include some micro intervals with NP spikes (> 150%). My HRV chart puts my readiness for today in the bottom right segment .
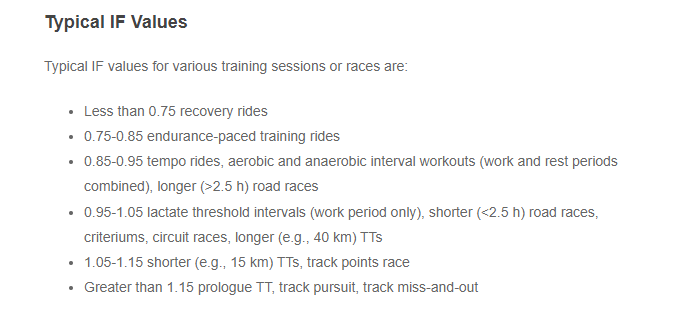
Comparing the IF for my planned session to the chart below from TP, 0.76 IF is just inside the endurance paced intensity boundary / just above recovery ride IF. I could easily make this an IF < 0.75 and keep the session basically the same
Could today’s session be considered a LIT session? I think I know the answer  but interested to hear opinions on this? If I’m feeling OK after work I will probably go ahead with this session.
It’s a good question, and if you’re unsure it’s always good to ask.
Yesterday was showing close to HIIT-ready, so today’s score could be impacted by a number of factors. One day won’t break you, so ride today’s plan based on feel. If you feel good keep going, if you feel below average then keep the number of bursts to a minimum.
When did you last do a HIT session?
How long are your bursts? 10, 15, 20s?
How much recovery between?
I have a similar workout, and HRV4Training suggests I limit intensity. If today was the third day in a row, I would consider it, but it’s the first day in yellow for a while.
What did you do when you had the day in the red? Top left. How did you feel after that.
It should give you an idea of how to approach today.
Thank you very much @Aindriu for pushing the Google Sheets version forward and building on the fantastic work of @Gerald and @MedTechCD.
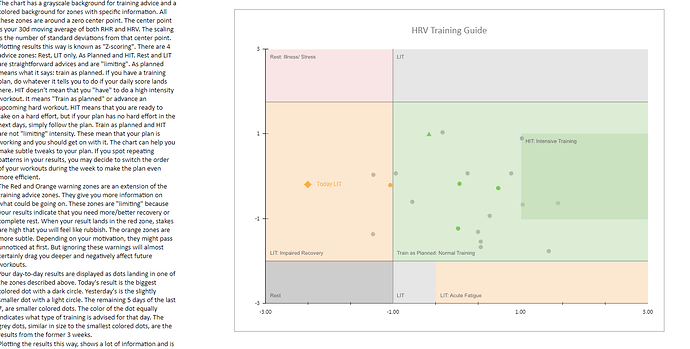
Not sure if of use but this morning I did a bit of a work around to get some imagery on top of the chart…
To do this I made a copy of the chart itself and pasted it onto the starter tab and resized it accordingly. I then downloaded an image of this chart. Then, inserted a drawing and imported the image of the chart. I then added coloured transparent boxes and text on top of the chart and once happy deleted the background chart image. When you save the drawing it is the perfect size to move and overlay on top of the chart as shown…
Proper fudge but seems to work!
Sharing is caring 


