Hi
Please could you tell me how you calculate Ramp? I am trying to recreate this but having no success as per information I am finding on this when doing Google searches.
Thanks
Matt
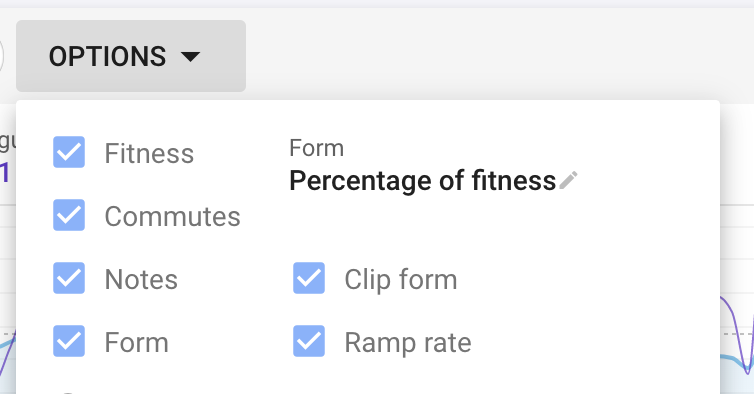
There are 2 ways to do this that I know of. The fitness page “Ramp rate” option plots the change in fitness from Monday to the previous Monday. The “Ramp” custom plot does this for every day looking at the same day on the previous week. A 7 day moving average is used by default.
1 Like
Thanks for the reply. I am specifically looking at the fitness page. I see that my TSS totals for the last 3 weeks are 752 (this week), 651 (last week) and 744 (week before). When I try to calculate it I get a ramp of - 13 for last week and + 14 for this week, but looking at the fitness chart I see 5.9 for last week and 0 for this week. If I understand you correctly, the Ramp value I am seeing on the fitness chart is purely a ramp up in calculated fitness level and is nothing to do with the Ramp Rate calculation based on TSS?
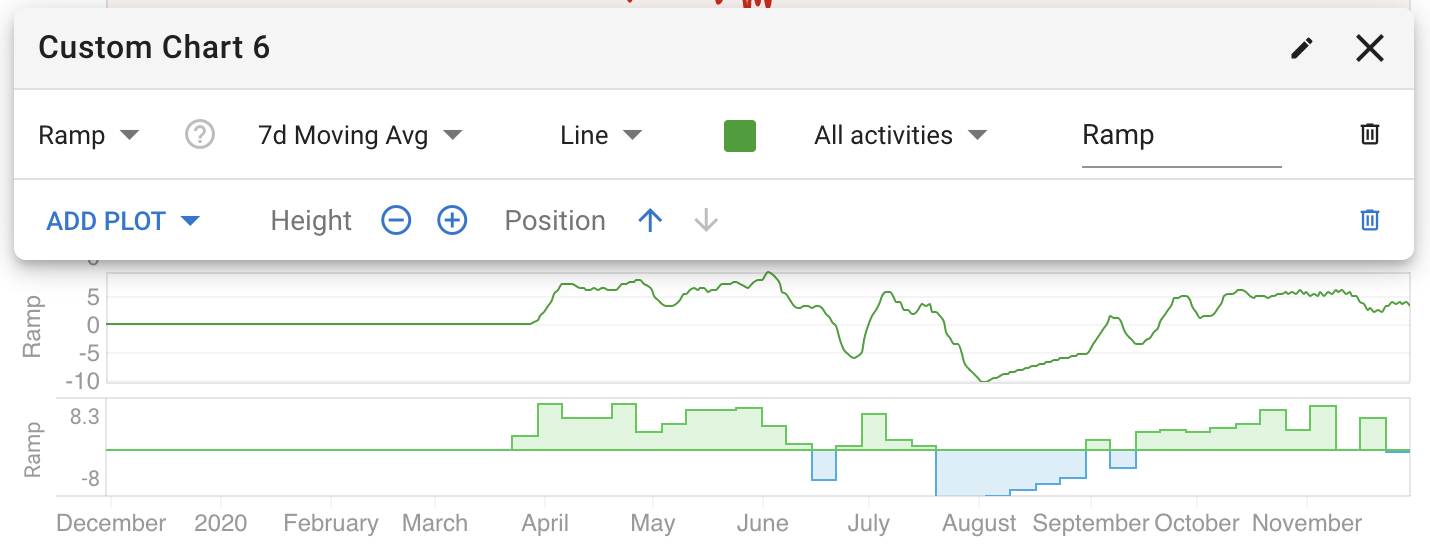
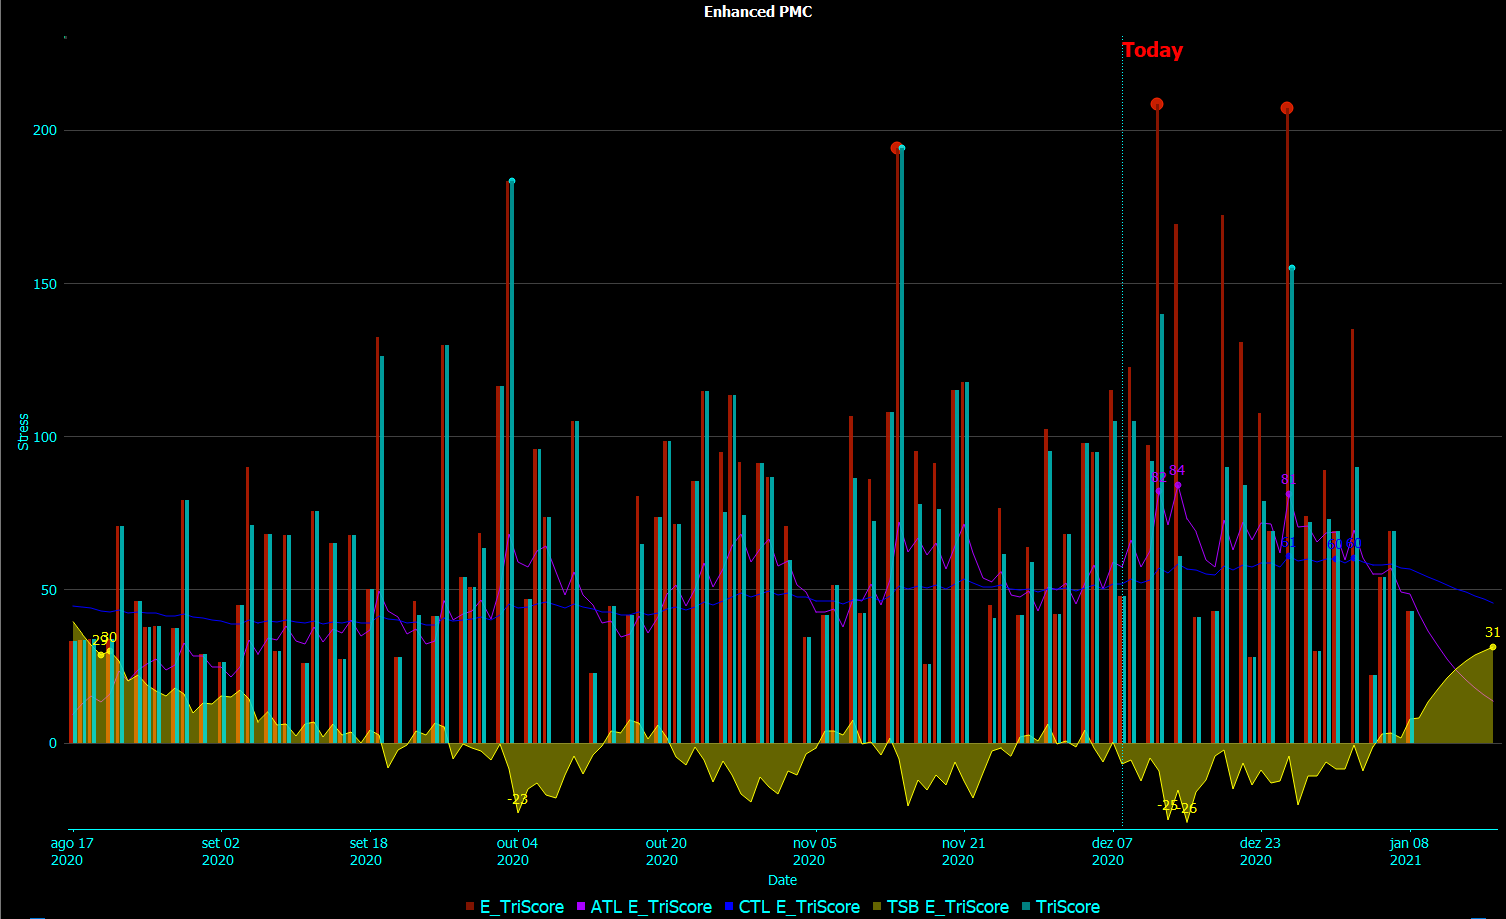
Yes and the fitness is a 42d exponentially weighted moving average of your training load. So your fitness on Mon 23rd was 70 and today it is 70 so the ramp for that week is zero. I actually like the “rolling ramp rate” chart better:
2 Likes
I actually did not know about that chart but I think I like that one more too! Thanks again!
1 Like
Exactly.
There two types of ramps:
CTL ramp (Fitness)
TSS ramp (Load)
I have found several contradict info about ramp and would nice If David with his knowledge could straight that for us, such as:
Recommended TSS Weekly Ramp 21 to 56 or TSS ramp max 8/10 %?
In addition to:
From Training Peaks
TSS less than 150 – low (recovery generally complete by following day)
150-300 – medium (some residual fatigue may be present the next day, but gone by 2nd day)
300-450 – high (some residual fatigue may be present even after 2 days)
Greater than 450 – very high (residual fatigue lasting several days likely)
If this my self very hard figures. TSS of 150 is hard for me and then comes the second doubt I have. This TSS classification should be as % of your current CTL (Fitness) . I guess.
Where I found this:
Hard workout: Add 50 to 100 percent to Fitness
Moderate workout: Add 25 percent to Fitness
Easy workout: Subtract 25 percent from Fitness
All the above pending confirmation.
Regards,
2 Likes
I actually don’t know a lot about this. Only started learning 2 years ago when I started this site. For me personally a 150 TSS ride will certainly take me longer than a day to recover from completely. It also depends on how that TSS was made up and what I try and do the next day. Age is also a factor in recovery time.
1 Like
I think the TSS ramp is more related to your current TSS level. For example, my last 8 weeks of training looks like this:
| Week No | TSS | CTL | CTL Ramp | ATL | ACWR |
|---|---|---|---|---|---|
| 2020_38 | 420 | 14 | 10 | 59 | 4.2 |
| 2020_39 | 313 | 21 | 7 | 46 | 2.1 |
| 2020_40 | 390 | 31 | 9 | 54 | 1.8 |
| 2020_41 | 565 | 44 | 13 | 83 | 1.9 |
| 2020_42 | 636 | 55 | 11 | 96 | 1.7 |
| 2020_43 | 700 | 72 | 17 | 94 | 1.3 |
| 2020_44 | 772 | 81 | 8 | 117 | 1.4 |
| 2020_45 | 682 | 89 | 9 | 91 | 1.0 |
| 2020_46 | 744 | 98 | 9 | 111 | 1.1 |
| 2020_47 | 651 | 100 | 2 | 87 | 0.9 |
| 2020_48 | 752 | 102 | 3 | 107 | 1.1 |
According to this page:
A reasonable ramp rate is one that you maintain for a few weeks before taking a break for a few days. While it depends to a great extent on who the athlete is, I’ve found that an increase in CTL of about 5 to 8 points per week is about right for most.
I had the summer off due to some home improvements projects so although it looks like I was ramping substantially in weeks 41 - 43 (and I probably was to some degree), I had built up a base fitness during spring and early summer so was able to cope with this.
Here I am calculating my last 6 weeks exponentially weighted average Chronic Training Load (CTL) and then calculating a weekly CTL Ramp by comparing the current week CTL to the previous week CTL.
Additionally I calculate the last 7 days exponentially weighted average Acute Training Load (ATL) and calculate the Acute:Chronic Workload Ratio (ACWR) by dividing the ATL by the CTL.
This page gives more information all of these terms, but in order to think about TSS per ride I cite this text:
CTL and TSS are related and you can use the scale below to determine the intensity of a workout with respect to your current fitness. In this example, we’ll assume the athlete has a CTL of 50.
Hard Workout – A hard workout will result in a TSS score that is 50%-100% above your current CTL (TSS for a hard workout would be 75 – 100 TSS.)
Moderate Workout – A moderate workout will result in a TSS score that is 25% above your current CTL (TSS for a moderate workout would be 60-70 TSS.)
Easy Workout – An easy workout will result in a TSS score that is 10-25% below your current CTL (TSS for an easy workout would be 35-40 TSS)
As my CTL sits around 100 at present, I imagine that I should double those numbers so a Hard Workout would be 50% - 100% above 100, i.e. 150 - 200 TSS. A Moderate Workout should be 25% above my CTL, i.e. 125 TSS. An Easy Workout should be 10-25% below my CTL, i.e. 75-90 TSS.
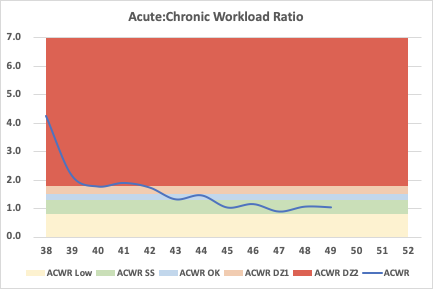
I also found some interesting information about the ACWR from this page:
According to research by Dr. Tim Gabbett, the ‘sweets spot’ ratio when the risk of injury is reduced is 0.8-1.3
<1 – Athlete in a well-prepared state
0.8-1.3 – Training ‘sweet spot’ where injury risk is reduced
1.5 – Danger zone. More at risk of injury
1.8 – Danger zone 2. Further increased risk of injury
For my purposes, I have plotted this on a chart so that I am able to understand exactly what my progress is and to ensure I am training at the level that I want to be:
@Gato_Felix: Does this make sense?
5 Likes
Yep. Pretty much the same I had written.
But ranges of 50%-100% as in for the Hard Workouts seams to be a little wide to me, don’t you agree?
Also, as David mentioned it totally depends n how this TSS was built what brings us back to my believe “we all” are still missing one metric to address that.
For instance this week I’m doing LI @ Threshold. Very demanding but TSS is still around 75 so Garmin keep saying me that my load is low…
Hey Matt,
I was looking the AWCR you’ve mentioned but it is calculated based on TRIMP and not TSS.
Is it still a valid metric?
Well spotted! I did not initially see that myself but having looked around a few pages it seems to me that there are various variables that can be used for this calculation. I cannot find something which conclusively says that this is used elsewhere, but I personally think that my TSS values based on watts compared with FTP would be a more reliable indicator than HR data which can vary due to a whole range of factors. I will keep digging over the coming days as I am surprised that ACWR and TSS does not return immediate results in a Google search. Having said that, the theory is to compare the ATL with the CTL and these are both metrics recognised in cycling using TSS so I would assume that they would have relevance. I would also say that the ranges I have seen in my charts would probably match up with my personal opinion of how hard I am training in comparison to my fitness in a given week.
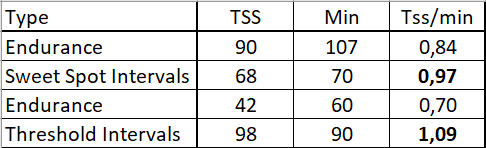
Nonetheless something came up from the source you gave. FirstBeat mentions Tss/min and I did saw something really interesting on that in order to quantify load coming from hard efforts and not only ride time.
Bellow you find my last 4 activities from this week and we can clearly see a direct correlation of this metric.
Just don’t know how to implement it in the load itself. Maybe multiplying the ratio by the load? square load? what ever… I have no idea. But it is something…
TSS/min should be related to intensity since TSS = intensity * intensity * hours * 100.
I know but as you can see in the table above it shows the “density” of a workout.
We a sweet spot workout of only 68 TSS with a higher TSS/min than an endurance workout of 90 TSS…
I mean maybe (maybe!  ) we could somehow account that density to reflect the fact that even been only a 68 TSS the SS interval workout was much much more stressful than endurance on of a 90 TSS. My legs can affirm that! so should the metrics too.
The way it is today I doubt of my informed “FORM” on PMC charts when doing intervals. For base endurance I think is in line.
Hi Guys,
I’ve managed (in a very low level …) to create the metric and the PMC to reflect the TSS/min factor in order to compensate for high intensity intervals loads.
Of course this will be subject to future validation based on my RPE.
Now I just have to find a way to not calculate when TSS/min <=1 because I believe TSS is well elaborate in that intensity.
{
calculate metric value
value { if (isSwim) TriScore^2*60/Duration;
else if (isRun) TriScore^2*60/Duration;
else TriScore^2*60/Duration;
}

I got it.
forgot the rational behind it:
{
# calculate metric value
value { if ((TriScore/(Time_Moving/60)100)>100) TriScore( TriScore/(Time_Moving/60));
else TriScore*1;
}
}
Digging up old posts to search about ramp Rate.
I am also wondering how ramp rate is being calculated.
Your example says that it’s MOnday to Monday calculation.(CTL = Fitness right?)
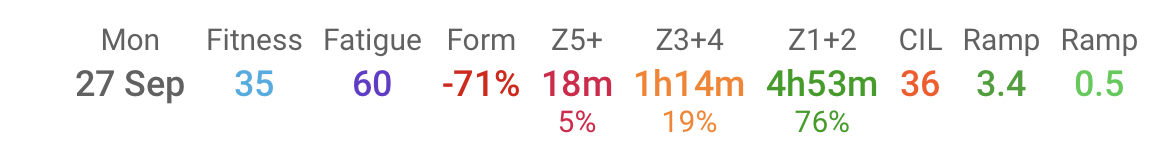
27Sep - Mon - Fit 35, 7day Ramp - 3.4, Ramp - 0.5,
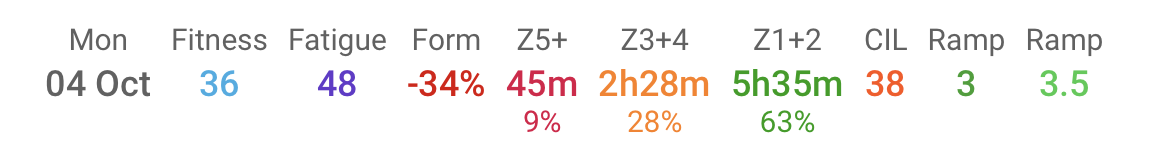
04Oct - Mon - Fit 36, 7day Ramp - 3, Ramp - 3.5,
I actually prefer the “rolling” ramp rate where today is compared to 7 days ago. The Monday to Monday thing is confusing especially at the start of a week.
1 Like