v0.22.0 — Dashboard, Themes & Multi-sport Performance Curve
April 28, 2026
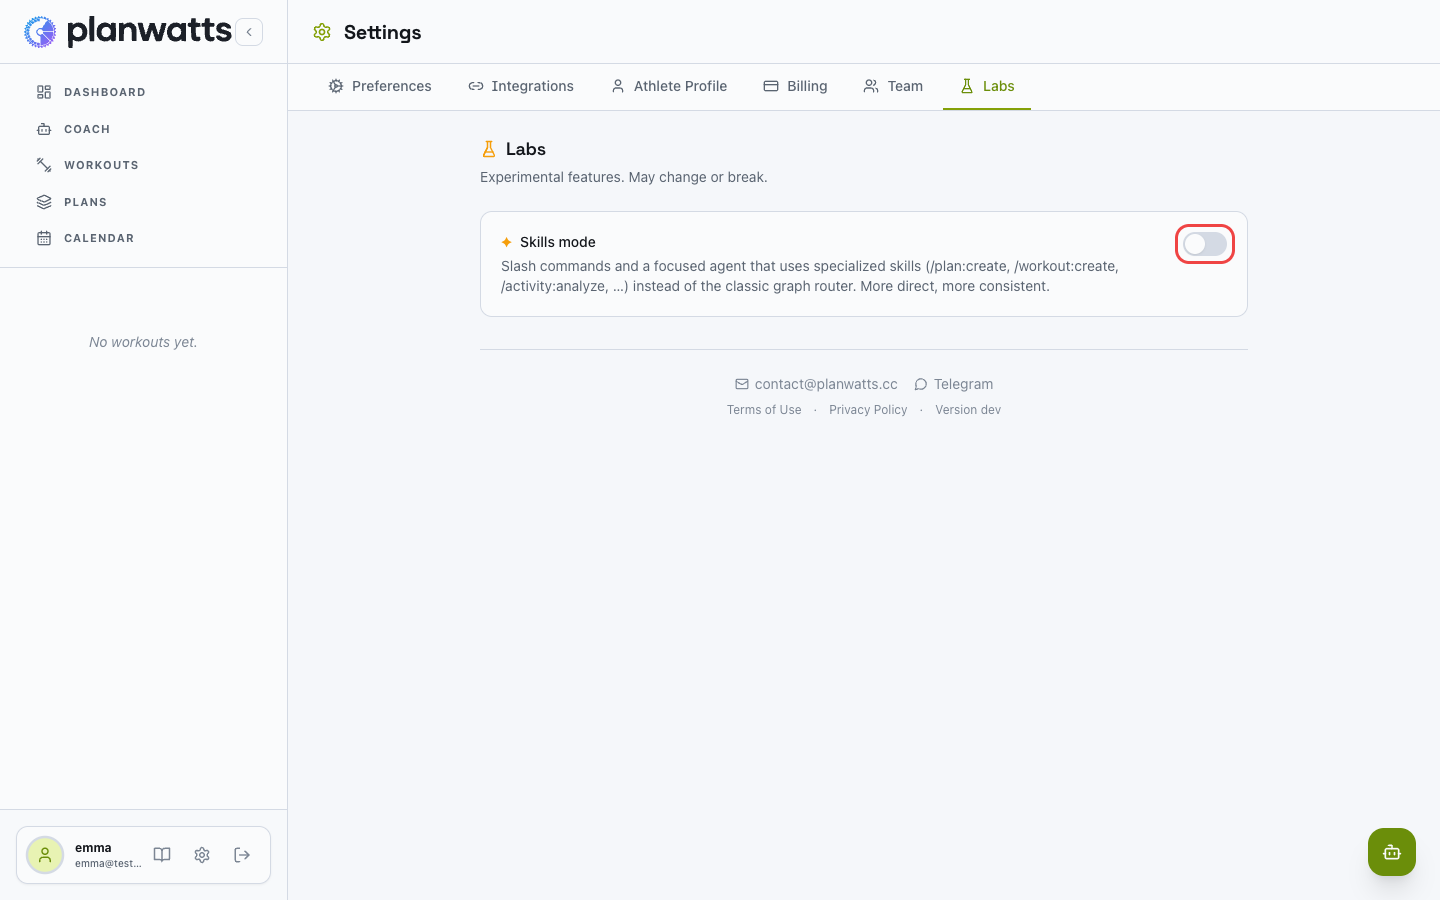
Skills mode is now opt-in
Open Settings → Labs and flip the switch to give your coach slash commands and a focused single-agent runtime — direct and consistent.
- Slash commands:
/plan:create,/workout:create,/activity:analyze, … - Classic graph mode stays the default.
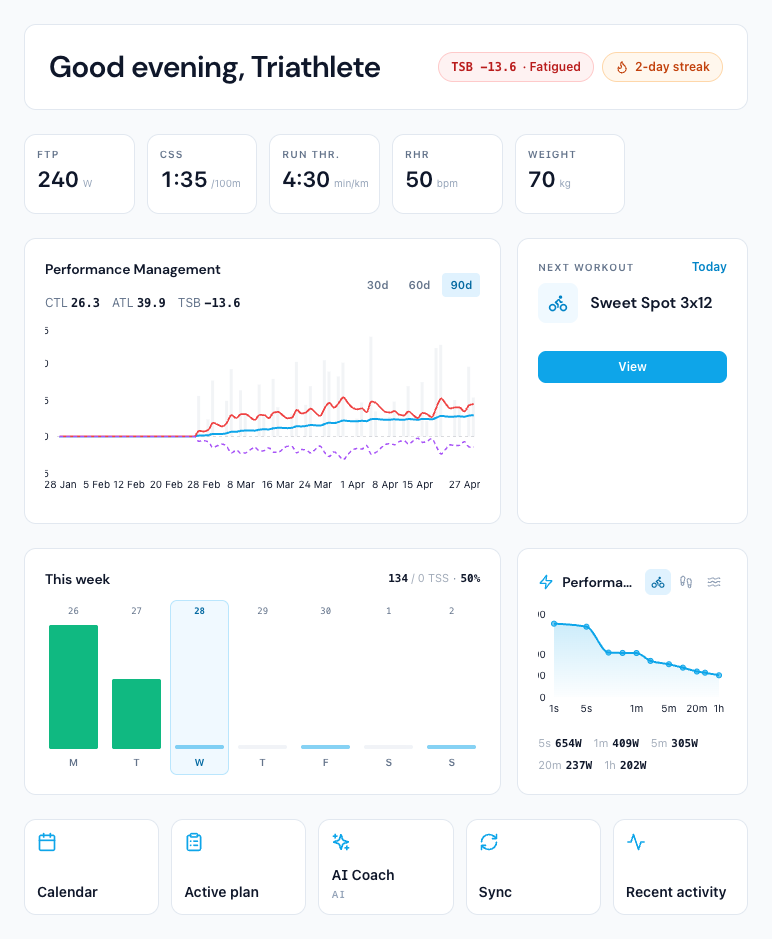
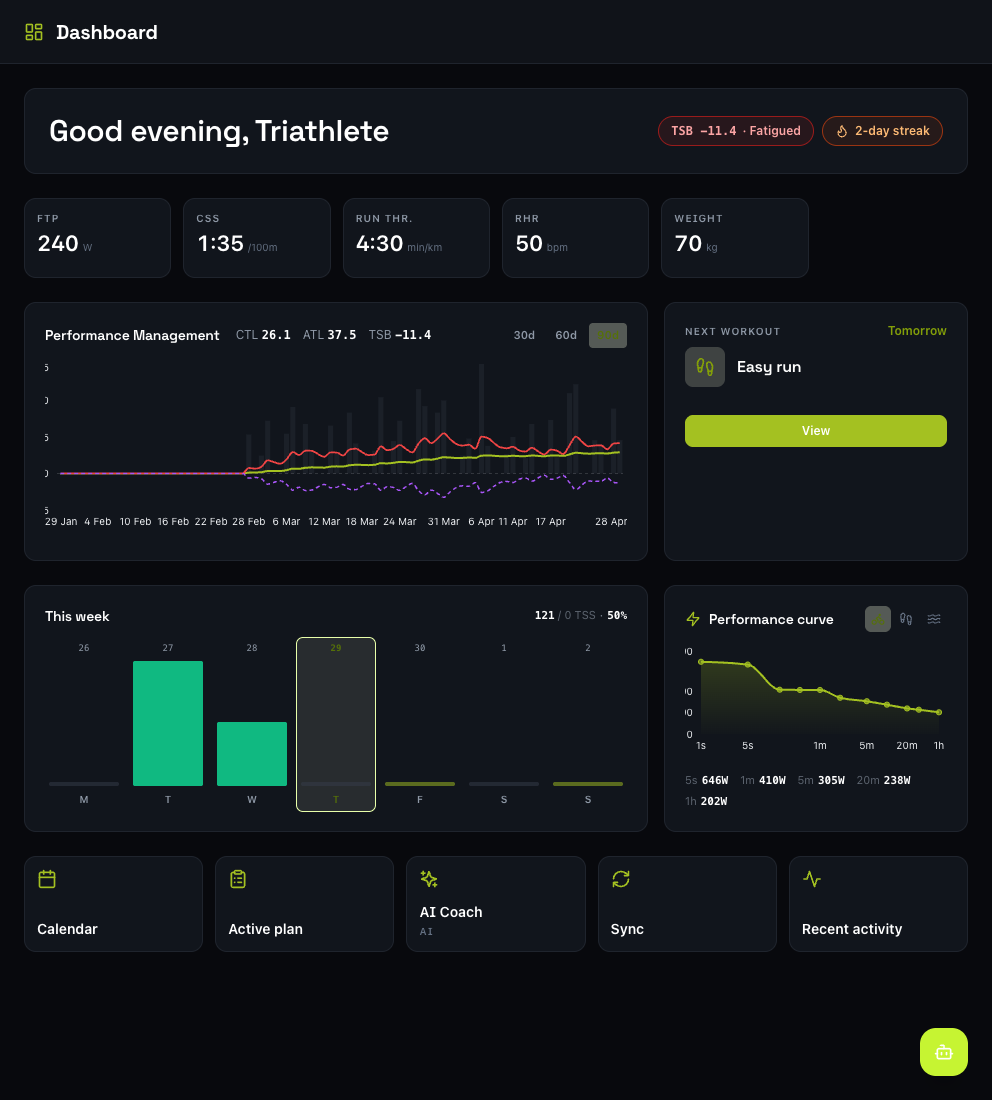
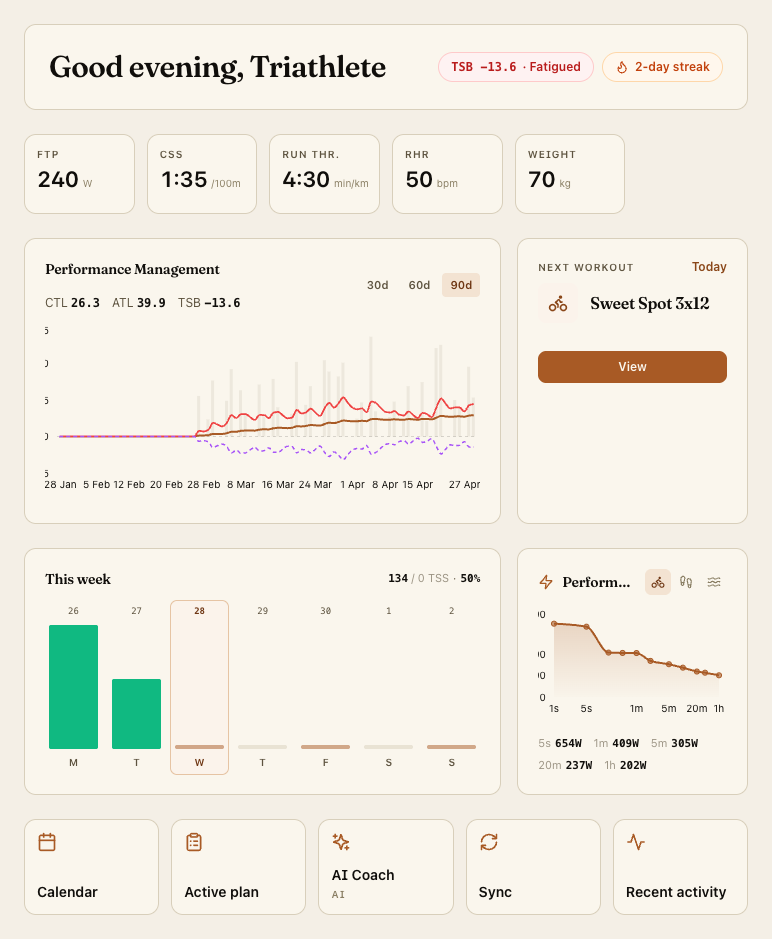
A new at-a-glance Dashboard
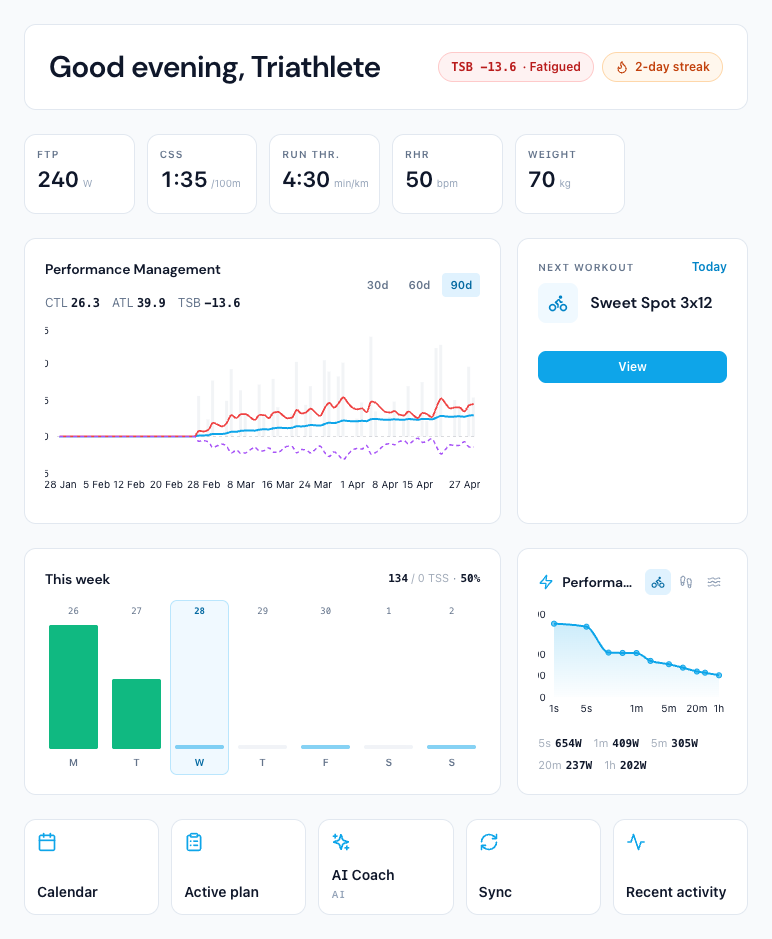
A single page summarising everything that matters today.
- Greeting reflects how fresh you are (TSB).
- Current FTP / CSS / run threshold / RHR / weight — metrics you don’t track stay hidden.
- 90-day PMC chart with CTL / ATL / TSB lines.
- Next workout, current-week planned-vs-actual TSS.
- Multi-sport Performance curve (see below).
- Shortcuts to Calendar, Plan, Coach, Sync, last activity.
One dashboard, three sports
The Performance curve adapts to what you train.
- Cyclists — real mean-max power curve (1 s sprint → 90 min), straight from your streams.
- Runners — pace curve (best mean pace per duration, min/km), inverted axis so faster sits higher.
- Swimmers — best pace per 100 m at each common distance bucket.
- Triathletes — sport switcher; auto-selects whichever sport you train most.
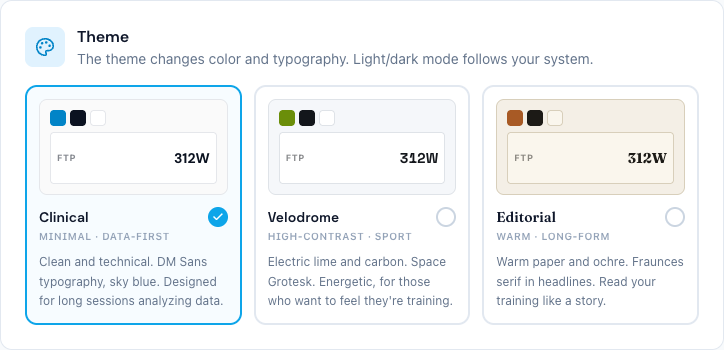
Three themes, one click away
Changes the full neutral palette and heading font (not just the accent). Light/dark still follows your system preference.
- Clinical — sky-blue + DM Sans. Minimal, data-first.
- Velodrome — electric lime on carbon neutrals, Space Grotesk. High-contrast, sporty.
- Editorial — warm cream, ochre, Fraunces serif. For reading your training like a story.
Your AI coach now draws charts
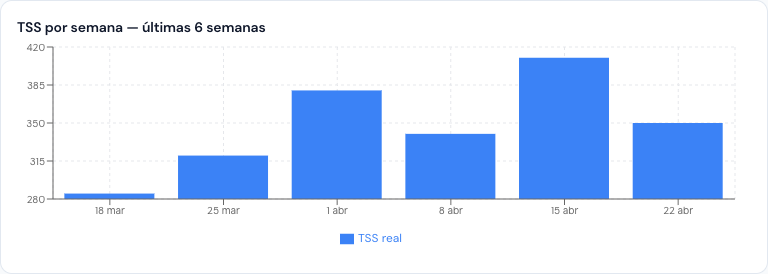
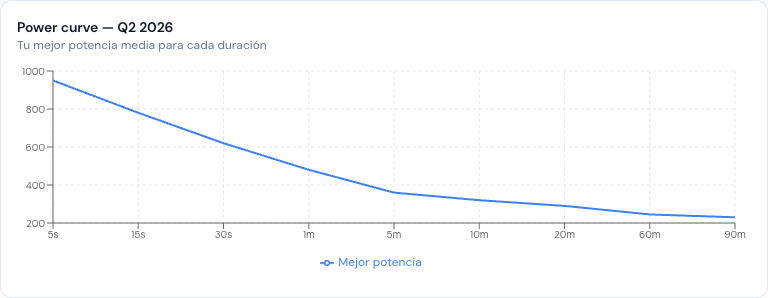
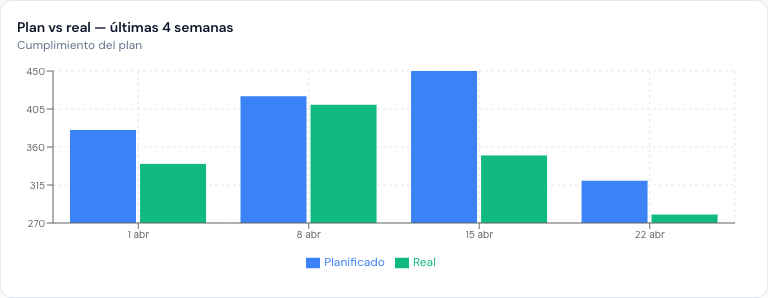
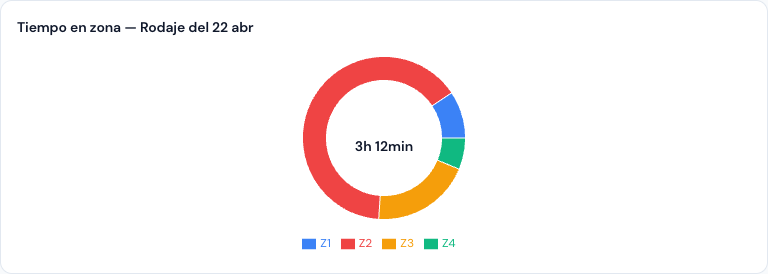
Ask the coach to visualize anything; it plots it in the chat. Combines activities + plan + streams into the right chart type (line, bar, area, pie/donut, scatter) without leaving the conversation.
Prompts that work:
- “Show me my weekly TSS for the last 6 weeks”
- “What does my power curve look like this quarter?”
- “How much time did I spend in each zone on my last long ride?”
- “Am I keeping up with the plan these last 4 weeks?”
Requires Skill mode (see below). Classic graph mode doesn’t have the charting tools yet.
Also fixed
- Activity analysis disputes now actually re-run. Telling the coach “the analysis is wrong, it was Z2–Z3” used to return the same cached result; it now re-runs.
- Custom zones honored in activity analysis. Athletes with non-Coggan zones (e.g. Kuepper) and range-target workouts no longer get misread as “pure Z2”.
- Friendlier tool labels in the chat thinking strip. Raw names like
aggregate_activitiesare replaced with localized descriptions in all six languages.