I am looking on Power/HR in Zone2 as one of my indicator to make training progress visible. By digging deeper into the figure i see one fundamental problem which is different training types.
For my understanding it helps a lot to compare your steady effort in this zone to see progress in endurace capacity, but if you do a high intense e.g interval training it „washes“ the figure, because if i go back for 2 min in Zone2 from a 2min high interval for sure the HR will be totally different than riding in Z2 coming from Z1 for example.
So my question is now:
is there any way to mark trainings as interval trainings and exclude them from the calculatioin or
does it make sense to have something like „weighted“ Z2/HR ? Which would be only calculated after a given time in the zone (adaption time) similar to eFTP.
Would appreciate some comments from experienced members in this forum, if my approach makes sense or if there are anyhow some „alternatives“ available.
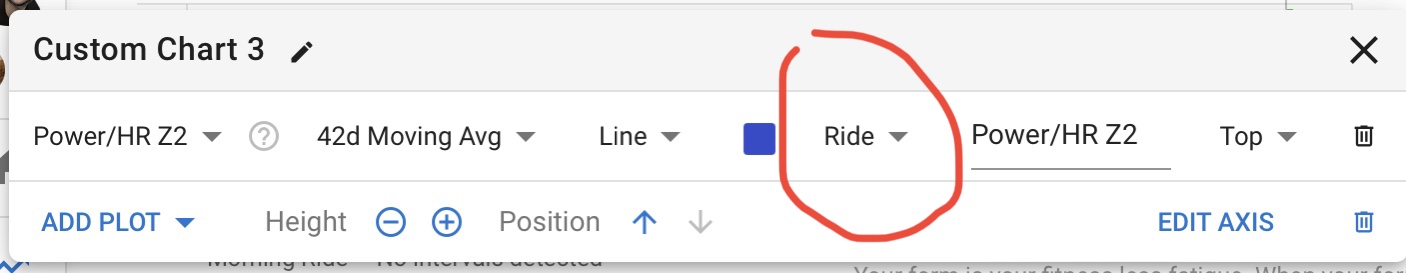
My line of thought is simple maybe too simple - i am looking at Power/HR in Z2 for a 42 day average and check the progress of the line.
Additionally on „Compare“ i check the Power/HR graph with season on monthly basis. I know in compare its not exactly the same figure as it is overall and not only Z2. At a given HR Treshold i can then see what is the average power i was able to ride for the particular season(month) and compare to the months before.
Hope this explains it a little bit. So in simple words i interprete „my progress in riding more power at the same heart“ rate in these graphs.
Line of thought is good but sometimes it is easier to compare single things then sum of things
The proper/easier thing to do would be to ride similar ride once a month (or choose one ride from yours, Z2 coffee ride on similar route etc.) and then set an interval starting 15 minutes into the ride and ending 15 min before the end. Now you can compare those intervals and check for power/Hr differences. And most importantly if you choose long ride you can look for HR decoupling and how it changes over time month to month (Power/HR ratio stays the same but you can hold it for longer). The concept is similar to testing FTP once a month.
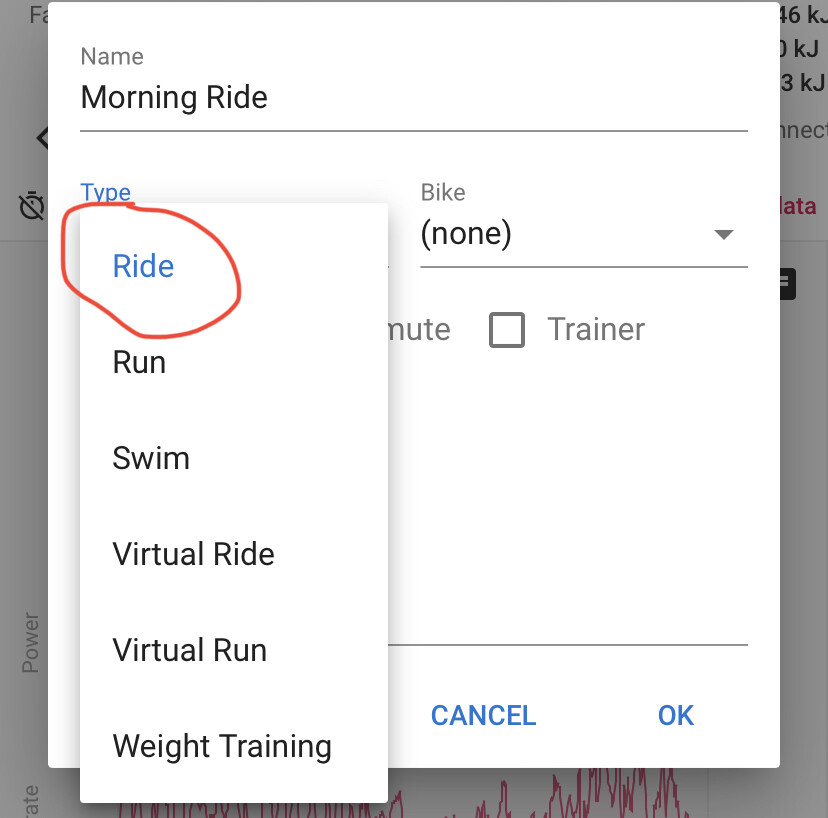
@Gerald thanks for this hint. I am using the type already for some other distinctions but maybe i will use the race/commute/training option which seems to be available as filter too and i am not using this at the moment.
@Lukasz_Pludowski: Absolutely agree that taking an average is not mostly accurate and a monthly FTP test is much more accurate (which I hate by the way). That‘s why I am looking for something like eFTP to have it available as rough estimate to check progress from a „helikopter view“ on your day to day rides.
However, the idea of taking same route and interval it makes sense to me and I will consider it in my planning.
I mean the idea behind Endurance rides is to build aerobic capacity. But you build it two ways. Long rides bring your HR down but to a point where it stays more or less constant for x amount of time (considering you are not super beginner). But the next step is to stretch that aerobic capacity in time, meaning you ride in similar Hr/Power ratio for longer and longer. But important thing to know is how long is long enough. Looking at avgs, you just miss that completely.
It doesn’t have to be exact ride each month. Just a steady ride without many stops at exact power (%of FTP) you can just look how your HR behaves in time at the same power input. If it rises after let’s say 2 hours, it’s worth considering next ride to be a little longer but 5h for example would be kind of pointless at that time. If your HR is lower during the whole ride, maybe it’s a good idea to consider an FTP test, to recheck if you are still riding in the same part of endurance zone.
I mean, there is no other way to know if your HR/power ratio during endurance rides is lower because of better aerobic endurance or higher FTP. They are all connected vessels
First of all thanks for taking the time to share your thoughts.
My concern on looking at each ride is, that especially HR is influenced by so many factors (temperature, mood, fatigue etc), so I was hoping to find my answer in averaging the values as it should reduce the influence of one time affects. But as said above I understand that this „washes“ the figures in another way
Not sure if putting decoupling into equation helps, since it puts the ride „just“ in 2 half.
As you rightly mention, you need to find the point in time of the ride where HR/power starts drifting away.
You can also filter activities by name … so you could put #z2 or something in the names of the rides you want to include.
Intervals.icu does do quite a bit of filtering to create the HR/power data (adjusts for lag, tosses out minutes with not moving time etc.) but doesn’t exclude “after hard effort” or “end of hot ride” minutes.
I have started to filtering as proposed but now I would have a request - would be cool to have name filter with “Not in” currently I think its only instring comparison
 maybe too simple - i am looking at Power/HR in Z2 for a 42 day average and check the progress of the line.