Hi all,
I recently have spent some time to create a power phase diagram:
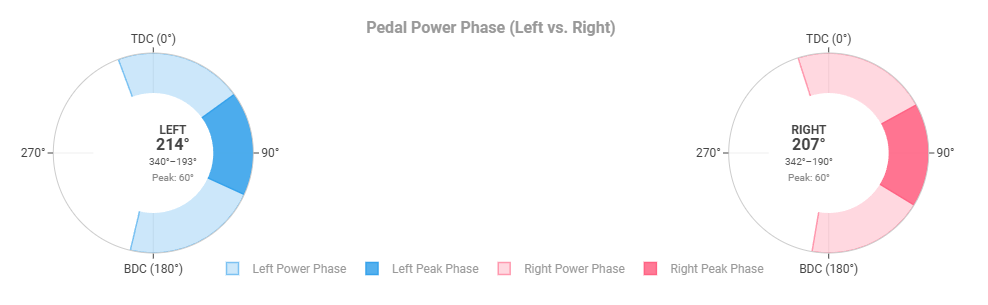
I am posting this as a guide on how to achieve this:
-
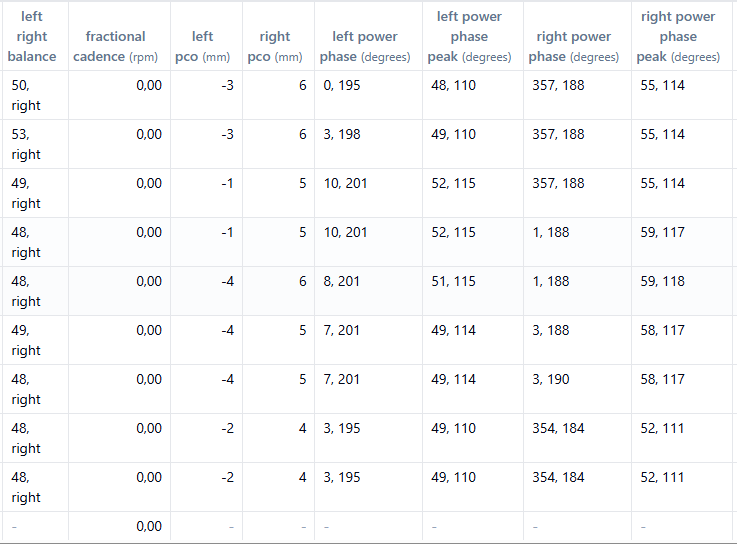
Make sure you have power phase L/R and peak power phase /LR dat in your fit file
E.g. by uploading the original fit file to fitfile viewer.
Note the power phase colums containing a pear of angles in degrees, one for the start and one for the end of the power phase.
-
Make that data available to Intervals via custom data streams
For the diagram we need one intervals data object (stream) for each of the 8 values listed above.
Hence we need to create 8 custom streams to represent the data (ignore the data in brakets for now)- Power Phase Left Start (Garmin Fitfile Field ID: m.f_69, array index [0])
- Power Phase Left End (Garmin Fitfile Field ID: m.f_69, array index [1])
- Power Phase Right Start (Garmin Fitfile Field ID: m.f_71, array index [0])
- Power Phase Right End (Garmin Fitfile Field ID: m.f_71, array index [1])
- Peak Power Phase Left Start (Garmin Fitfile Field ID: m.f_70, array index [0])
- Peak Power Phase Left End (Garmin Fitfile Field ID: m.f_70, array index [1])
- Peak Power Phase Right Start (Garmin Fitfile Field ID: m.f_72, array index [0])
- Peak Power Phase Right End (Garmin Fitfile Field ID: m.f_72, array index [1])
How this is done might higly depend on what devices are used to record the data. For a Garmin Edge 840 with Assiomo Pro RS pedals, the data ends up in 4 Fit fields containing a pair of angles: start and end degree. Hence we need custom streams to sperate the data in those 8 streams.
To do so:
-
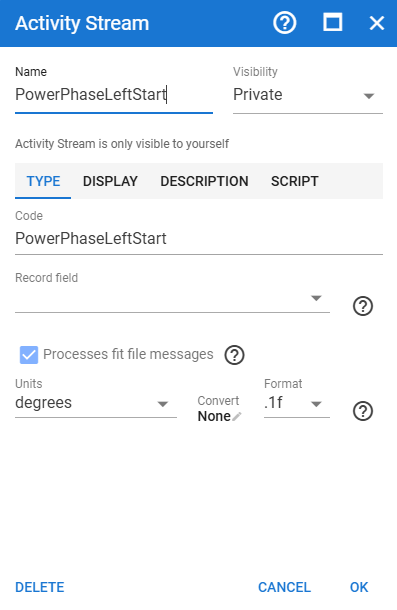
Create a custom stream:
From the activitys’ page → bottom menu “charts” → custom streams.
Name the stream according to the list above.
Check “Process fit file messagees”.
Select unit tye “degree”.
-
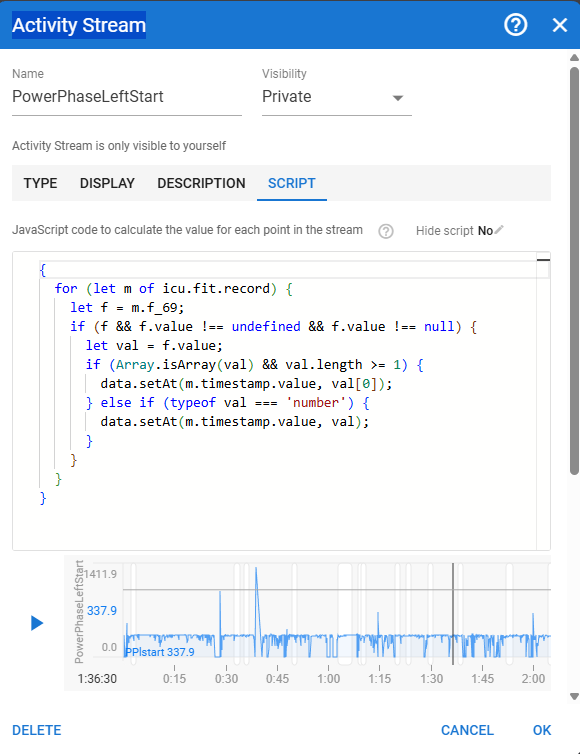
Switch to the “Script” tab and add the following code to extract the data to a flat stream.
Use the play button to test if you get any errors.
Use the field ids and array indexes as give above for the 8 streams by replacing “m.f_69” and “val[0]” with the above mentined ids and index values.
-
Reprocess the data for the activity
To have the streams populated with data for the activity we need to reprocess the activity on intervals. From the activitys’ bottom menue → Actions → Reprocess File. -
Create a custom chart
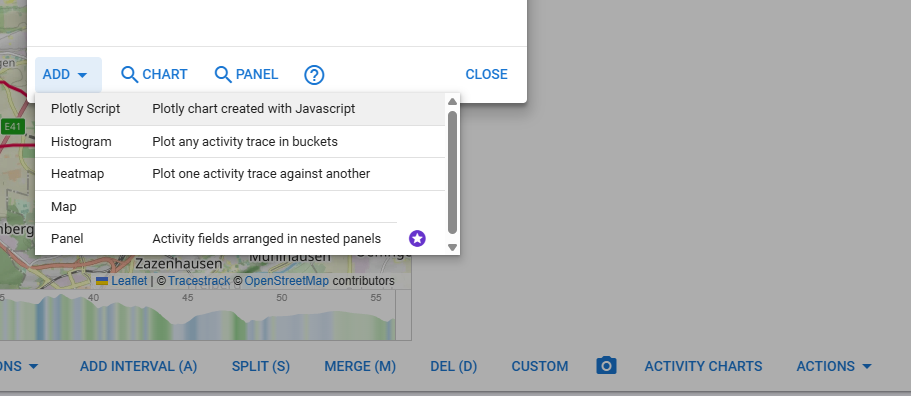
- add a new chart that is created with Javascript Code: From the activitys’ bottom menue → Activity Charts → Add → Ploty Script
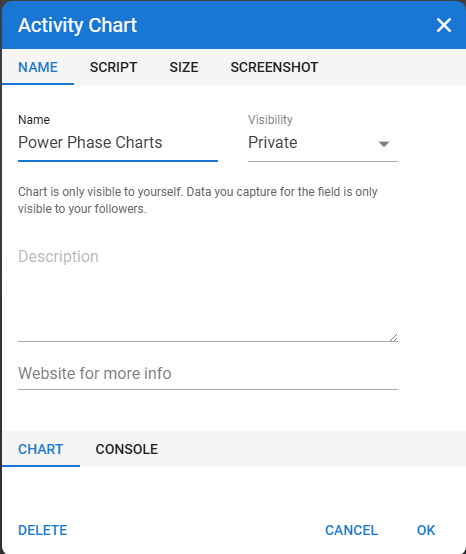
- name your new chart
- add the following Java Script Code to the editor in the Script Tab to create your chart:
Java Script Code
// 1. Fetch our 8 Garmin Custom Streams from Intervals.icu

const ppLStart = icu.streams.get("PowerPhaseLeftStart")?.data || \[\];

const ppLEnd = icu.streams.get("PowerPhaseLeftEnd")?.data || \[\];

const ppRStart = icu.streams.get("PowerPhaseRightStart")?.data || \[\];

const ppREnd = icu.streams.get("PowerPhaseRightEnd")?.data || \[\];


const pppLStart = icu.streams.get("PowerPhasePeakLeftStart")?.data || \[\];

const pppLEnd = icu.streams.get("PowerPhasePeakLeftEnd")?.data || \[\];

const pppRStart = icu.streams.get("PowerPhasePeakRightStart")?.data || \[\];

const pppREnd = icu.streams.get("PowerPhasePeakRightEnd")?.data || \[\];


// 2. Vector-Based Circular Mean Function (Trig Vector Averaging)

function getCircularAverage(angles) {

 let validAngles = angles.filter(a => a !== null && a !== undefined && a !== 0);

 if (validAngles.length === 0) return null;


 let sinSum = 0;

 let cosSum = 0;


 for (let i = 0; i < validAngles.length; i++) {

   let rad = (validAngles\[i\] \* Math.PI) / 180;

   sinSum += Math.sin(rad);

   cosSum += Math.cos(rad);

 }


 let avgRad = Math.atan2(sinSum / validAngles.length, cosSum / validAngles.length);

 let avgDeg = (avgRad \* 180) / Math.PI;

 return (avgDeg + 360) % 360;

}


// 3. Calculate Ranges and Centers

const avgLStart = getCircularAverage(ppLStart);

const avgLEnd = getCircularAverage(ppLEnd);

const leftRange = avgLStart !== null && avgLEnd !== null ? (avgLEnd - avgLStart + 360) % 360 : null;

const leftCenter = avgLStart !== null && leftRange !== null ? (avgLStart + leftRange / 2) % 360 : null;


const avgRStart = getCircularAverage(ppRStart);

const avgREnd = getCircularAverage(ppREnd);

const rightRange = avgRStart !== null && avgREnd !== null ? (avgREnd - avgRStart + 360) % 360 : null;

const rightCenter = avgRStart !== null && rightRange !== null ? (avgRStart + rightRange / 2) % 360 : null;


const avgLPeakStart = getCircularAverage(pppLStart);

const avgLPeakEnd = getCircularAverage(pppLEnd);

const leftPeakRange = avgLPeakStart !== null && avgLPeakEnd !== null ? (avgLPeakEnd - avgLPeakStart + 360) % 360 : null;

const leftPeakCenter = avgLPeakStart !== null && leftPeakRange !== null ? (avgLPeakStart + leftPeakRange / 2) % 360 : null;


const avgRPeakStart = getCircularAverage(pppRStart);

const avgRPeakEnd = getCircularAverage(pppREnd);

const rightPeakRange = avgRPeakStart !== null && avgRPeakEnd !== null ? (avgRPeakEnd - avgRPeakStart + 360) % 360 : null;

const rightPeakCenter = avgRPeakStart !== null && rightPeakRange !== null ? (avgRPeakStart + rightPeakRange / 2) % 360 : null;


// 4. Trace and Annotation setup

const traces = \[\];

const annotations = \[\];


const colors = {

 leftMain: "rgba(54, 162, 235, 0.25)",

 leftMainBorder: "rgba(54, 162, 235, 0.6)",

 leftPeak: "rgba(54, 162, 235, 0.85)",

 leftPeakBorder: "rgba(54, 162, 235, 1.0)",

 rightMain: "rgba(255, 99, 132, 0.25)",

 rightMainBorder: "rgba(255, 99, 132, 0.6)",

 rightPeak: "rgba(255, 99, 132, 0.85)",

 rightPeakBorder: "rgba(255, 99, 132, 1.0)"

};


// --- LEFT PEDAL PLOT ---

if (leftCenter !== null && leftRange !== null) {

 traces.push({

   type: "barpolar",

   subplot: "polar",

   name: "Left Power Phase",

   r: \[1.0\],

   theta: \[leftCenter\],

   width: \[leftRange\],

   marker: {

     color: colors.leftMain,

     line: { color: colors.leftMainBorder, width: 1.5 }

   },

   hoverinfo: "text",

   text: \["Left Power Phase: " + avgLStart.toFixed(0) + "° - " + avgLEnd.toFixed(0) + "° (" + leftRange.toFixed(0) + "°)"\]

 });


 if (leftPeakCenter !== null && leftPeakRange !== null) {

   traces.push({

     type: "barpolar",

     subplot: "polar",

     name: "Left Peak Phase",

     r: \[1.0\],

     theta: \[leftPeakCenter\],

     width: \[leftPeakRange\],

     marker: {

       color: colors.leftPeak,

       line: { color: colors.leftPeakBorder, width: 1.5 }

     },

     hoverinfo: "text",

     text: \["Left Peak Phase: " + avgLPeakStart.toFixed(0) + "° - " + avgLPeakEnd.toFixed(0) + "° (" + leftPeakRange.toFixed(0) + "°)"\]

   });

 }


 traces.push({

   type: "barpolar",

   subplot: "polar",

   r: \[0.6\],

   theta: \[0\],

   width: \[360\],

   marker: { color: "#ffffff" },

   hoverinfo: "skip",

   showlegend: false

 });


 annotations.push({

   text: "<b>LEFT</b><br><span style='font-size:16px; font-weight:bold;'>" + leftRange.toFixed(0) + "°</span><br><span style='font-size:10px; color:#555;'>" + avgLStart.toFixed(0) + "°–" + avgLEnd.toFixed(0) + "°</span><br><span style='font-size:10px; color:#888;'>Peak: " + (leftPeakRange ? leftPeakRange.toFixed(0) : "N/A") + "°</span>",

   xref: "paper", yref: "paper",

   x: 0.22,

   y: 0.5,

   showarrow: false,

   align: "center"

 });

}


// --- RIGHT PEDAL PLOT ---

if (rightCenter !== null && rightRange !== null) {

 traces.push({

   type: "barpolar",

   subplot: "polar2",

   name: "Right Power Phase",

   r: \[1.0\],

   theta: \[rightCenter\],

   width: \[rightRange\],

   marker: {

     color: colors.rightMain,

     line: { color: colors.rightMainBorder, width: 1.5 }

   },

   hoverinfo: "text",

   text: \["Right Power Phase: " + avgRStart.toFixed(0) + "° - " + avgREnd.toFixed(0) + "° (" + rightRange.toFixed(0) + "°)"\]

 });


 if (rightPeakCenter !== null && rightPeakRange !== null) {

   traces.push({

     type: "barpolar",

     subplot: "polar2",

     name: "Right Peak Phase",

     r: \[1.0\],

     theta: \[rightPeakCenter\],

     width: \[rightPeakRange\],

     marker: {

       color: colors.rightPeak,

       line: { color: colors.rightPeakBorder, width: 1.5 }

     },

     hoverinfo: "text",

     text: \["Right Peak Phase: " + avgRPeakStart.toFixed(0) + "° - " + avgRPeakEnd.toFixed(0) + "° (" + rightPeakRange.toFixed(0) + "°)"\]

   });

 }


 traces.push({

   type: "barpolar",

   subplot: "polar2",

   r: \[0.6\],

   theta: \[0\],

   width: \[360\],

   marker: { color: "#ffffff" },

   hoverinfo: "skip",

   showlegend: false

 });


 annotations.push({

   text: "<b>RIGHT</b><br><span style='font-size:16px; font-weight:bold;'>" + rightRange.toFixed(0) + "°</span><br><span style='font-size:10px; color:#555;'>" + avgRStart.toFixed(0) + "°–" + avgREnd.toFixed(0) + "°</span><br><span style='font-size:10px; color:#888;'>Peak: " + (rightPeakRange ? rightPeakRange.toFixed(0) : "N/A") + "°</span>",

   xref: "paper", yref: "paper",

   x: 0.78,

   y: 0.5,

   showarrow: false,

   align: "center"

 });

}


if (traces.length === 0) {

 annotations.push({

   text: "No Power Phase data streams available for this activity.",

   xref: "paper", yref: "paper", x: 0.5, y: 0.5,

   showarrow: false, font: { size: 14 }

 });

}


// 5. Final Chart Configuration

chart = {

 data: traces,

 layout: {

   title: {

     text: "<b>Pedal Power Phase (Left vs. Right)</b>",

     font: { size: 16 }

   },

   showlegend: true,

   legend: {

     orientation: "h",

     yanchor: "bottom",

     y: -0.15,

     xanchor: "center",

     x: 0.5

   },

   barmode: "overlay",

   paper_bgcolor: "rgba(0,0,0,0)",

   plot_bgcolor: "rgba(0,0,0,0)",

   margin: { t: 40, b: 60, l: 30, r: 30 },


   polar: {

     domain: { x: \[0.0, 0.45\], y: \[0.0, 1.0\] },

     angularaxis: {

       rotation: 90,

       direction: "clockwise",

       tickvals: \[0, 90, 180, 270\],

       ticktext: \["TDC (0°)", "90°", "BDC (180°)", "270°"\],

       gridcolor: "#eeeeee",

       linecolor: "#cccccc"

     },

     radialaxis: {

       range: \[0.0, 1.0\],

       visible: false

     }

   },


   polar2: {

     domain: { x: \[0.55, 1.0\], y: \[0.0, 1.0\] },

     angularaxis: {

       rotation: 90,

       direction: "clockwise",

       tickvals: \[0, 90, 180, 270\],

       ticktext: \["TDC (0°)", "90°", "BDC (180°)", "270°"\],

       gridcolor: "#eeeeee",

       linecolor: "#cccccc"

     },

     radialaxis: {

       range: \[0.0, 1.0\],

       visible: false

     }

   },

   annotations: annotations

 }

};


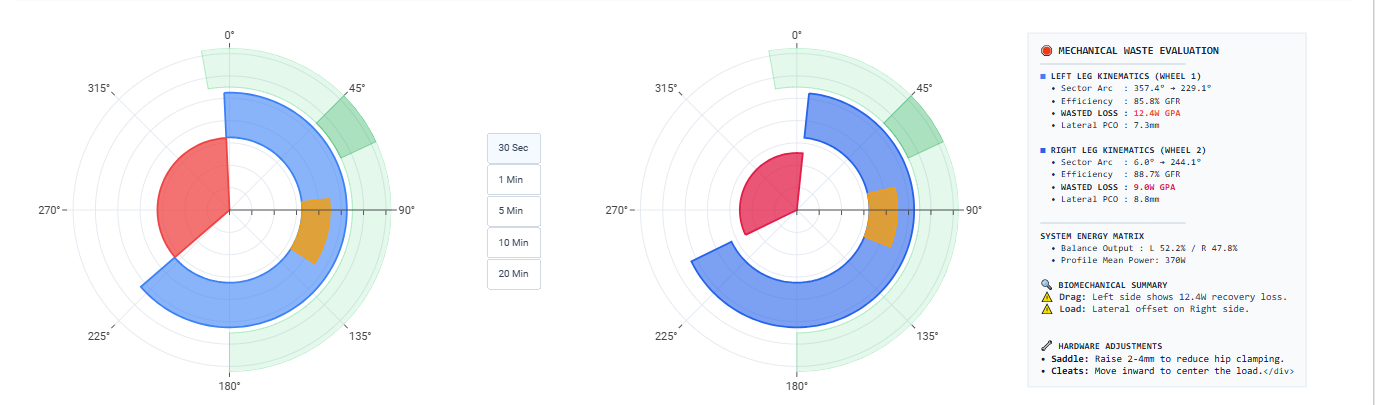
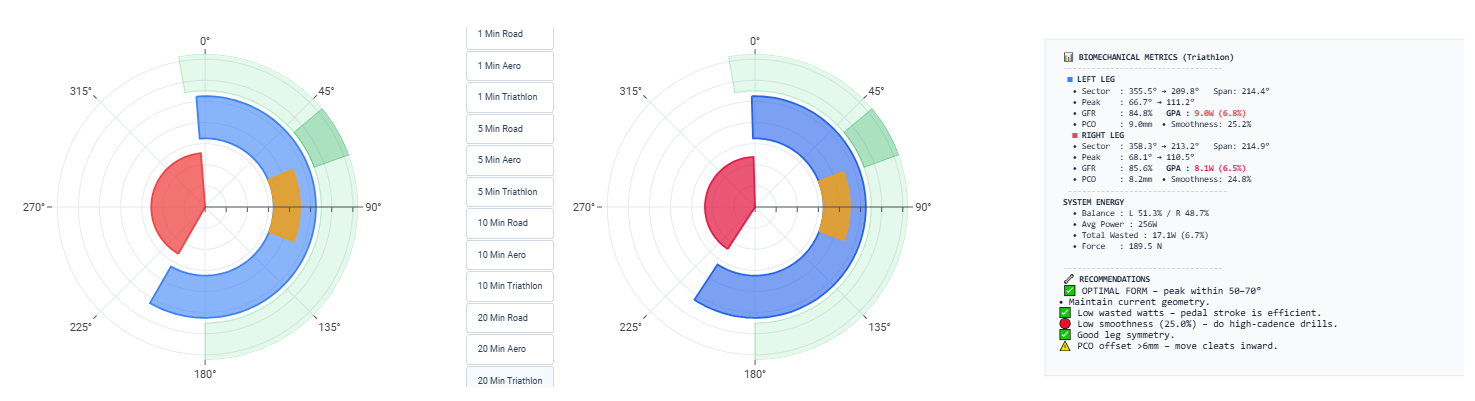
 Biomechanical Power-Loss Profiler