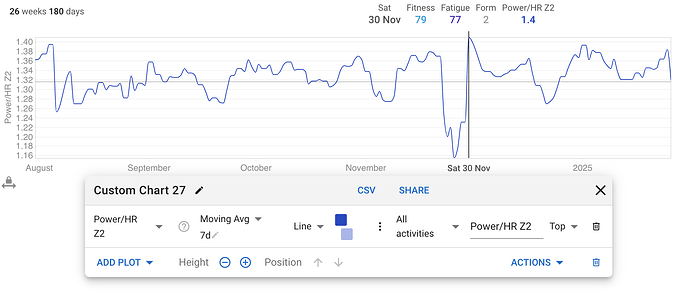
How do you add this to charts?
Sorry I thought the reply would go directly to the post. Interested how I get this plot - looks really interesting
The median cadence for all the Z2 buckets is calculated. The only buckets with cadence between 92% and 115% of the median are kept.
1 Like
Thanks
