You might have a point. I am going to add more filtering options to the custom charts soon e.g. on intensity for this use-case.
Is it possible to add Normalized Power/HR in Z2 as this is comparable to the Efficiency Factor calculation which is, according to eg. Friel the basis to calculate FAeT? So I am wondering why average power instead of normalized power is used.
That is already available as parameter for detected or manually set intervals.
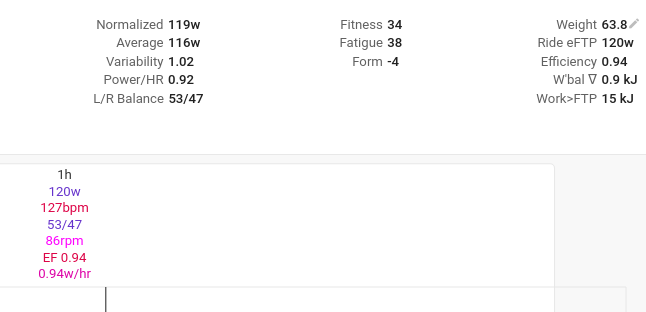
For the entire workout you also have pwr/HR Z2 based on avg and EF based on NP.
I used average power because there is a linear relationship between power and HR (until about threshold anyway) so this seemed like a better option than NP.
Thanks but not sure if I got that. Therefore, please let me explain further:
I want to see the EF for zone 2 only and not for the entire workout in all zones. Especially, I would like to see EF for zone 2 over all workouts on my /Fitness page and not just for the single activity. Therefore, I hope that EF in zone 2 (= NP in zone 2/HR in zone 2) can be added as chart on the fitness page.
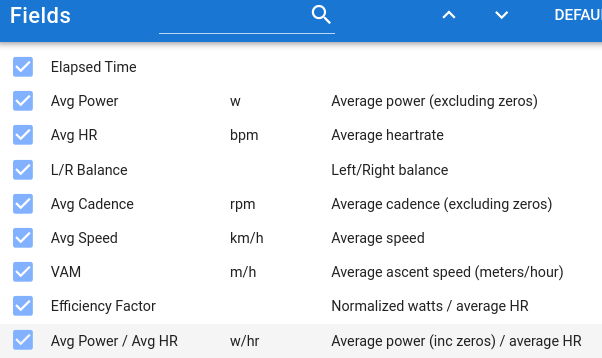
The already existing chart use average and not normalized power.
Thanks David. I am for sure not an expert in these questions. I mainly reference to what I read in Friels training bible. Personally, I think it does not matter if you use AvgP or NP in case of constant ERG activities where both values are very similar. However, if the real effort or stress is much higher (measured in NP) in course of some workouts; especially for outdoor activities or indoor races/non-ERG rides, it may no longer be possible to compare these ride types or better may lead to a wrong chart development and interpretation.
For example: The chart decreases and tells me that my aerobic fitness decreased, but actually the reason for that is that the NP of my last rides was significantly higher than the AvgP. Accordingly, my HR was higher than in course of a series of former constant ERG-rides with a similar AvgP and NP value. To eliminate this element I believe it’s better to use NP.
What do you think, makes that sense?
Hmm yes that does make sense. I hadn’t thought about it that way. Will have to see what I can do!
1 Like
EF and decoupling make not much sense if used for none-steady efforts. HR lags, NP is very dependent on power changes… And don’t forget that cadence plays a big role too! Same power at a higher cadence usualy gives a higher HR.
The concept EF and decoupling was based on a constant effort, unless I’m mistaking.
I use it to detect small performance gains over shorter periods. Even disgarding the first two minutes of a longer steady state effort, just to avoid influence of HR lag.
Typically, if you increase Power a bit, you first see a rise in EF (good). In many cases decoupling also rises (not good). Then, when keeping power equal, decoupling drops and you know you are ready to increase power again. If you use DFA Alpha 1, this is even more sensitive and a first predictor of the fact that you’re adapting or not.
AIEndurance proposes an introduction of two new parameters based on Alpha1 for tracking Aerobic fitness:
3 Likes
Hi david!
Neat little add on, this!
I have also noticed that Intervals.icu now sort of “predicts” Power/HR in Z2 in the Fitness tab.
How does this work?
Thanks!
I have fixed this. The moving averages on things like power/HR leave out days with no data. So if there are 30/42 days with data then the total for the last 42 days is divided by 30 and not 42. This was causing it to be “projected” into the future.
3 Likes
Oh I see, cool that I somehow helped make Intervals better 
1 Like
Hi David, any news on that to add a data field for NP/HR in Z2? Thanks and regards, Martin
where is this chart? cant find it
Custom chart on the fitness page
Hello! Sorry this is bit of a bump, but I have a related question…
I am one of those stupid people who rides silly bikes with no gears. The power / Z2 HR is a perfect metric for me (mostly endurance events) but the cadence range of 92-115% discards the majority of my useful data.
For example… avg cadence for a whole ride might be mid to high 60s, but the toughest climbs (where I would really like to know how efficient I am) will be done at way less than 92% of this, often as low as 60% (or ‘worse’!), and flatter sections could see spinning at 110rpm or ~160% of average.
I have been tracking power/HR on an indoor trainer, and this sort of riding has given a very wide ‘power band’ (exactly the same power/HR values from 50 to 90 rpm), so I would love to see if this translates into the real world too.
Is there an option anywhere to set your own ‘range’ for cadence for the power/Z2 function, or would it possible to consider adding this?
Huge thanks for a brilliant piece of software and your continued support!
1 Like
Tx. It would be possible to make that range configurable in sport settings with a bit of work. I have added that to the todo list. Changing it would involve recalculating power / Z2 HR for all activities.
1 Like
Thank you, David! So amazing to have contact with the developer in this way, who is open to feedback and suggestions.
Look forward to trying this out whenever it becomes available. Thanks again.
Are the power zones used only for cycling? I also run with power so I’ve created two separate charts filtered on activities for cycling and running. I’m not sure that the running chart is accurate based on power Z2.
Go to settings page and configure all zones and parameters per sport.
1 Like
How has the filter been set since then?