Hello everyone! I am absolutely ashamed to post a simple question like that, but I have been trying to get a specific data show onto activity page for 15+ hours and couln’t figure it out.
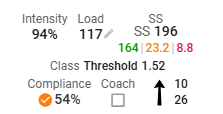
Few months ago Intervals.icu introduced xSS/SS that I managed to show on activity page (screen below) and it works absolutely amazing.
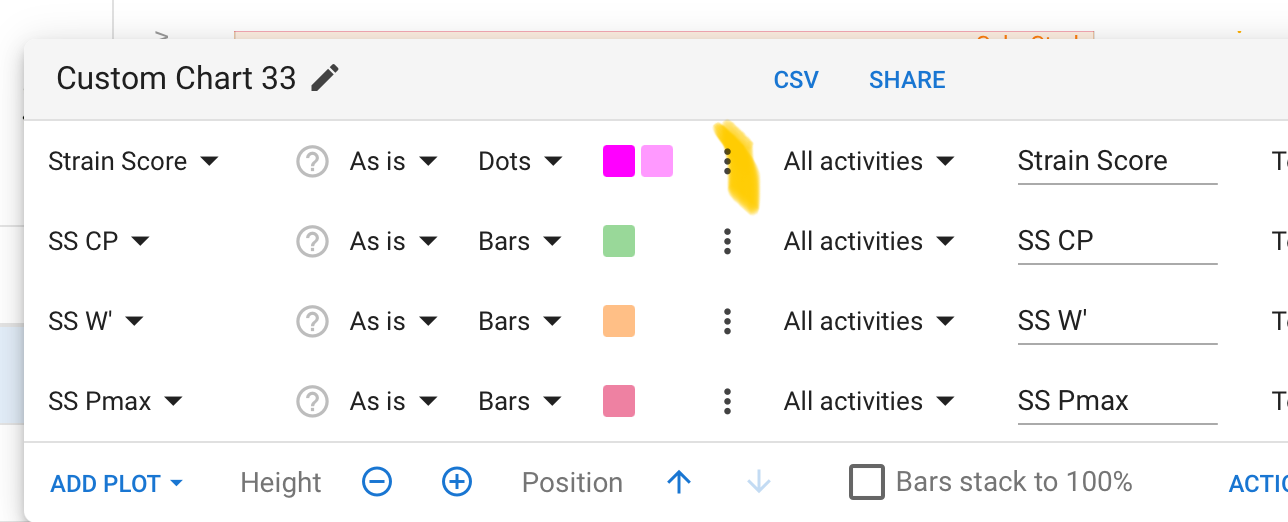
R2Tom’s approach will work. What you can also do is use a custom activity field to replace the Intervals.icu training load (basically TSS) with XSS. We haven’t added this as a default option because XSS is often quite a bit more than TSS (my most recent ride XSS=248 TSS=209) and the other load calculators for HR and pace output TSS.
Add a custom activity field “XSS Load” with a script like this:
{
  if (activity.strain_score) activity.icu_training_load = Math.floor(activity.strain_score + 0.5)
  activity.strain_score
}
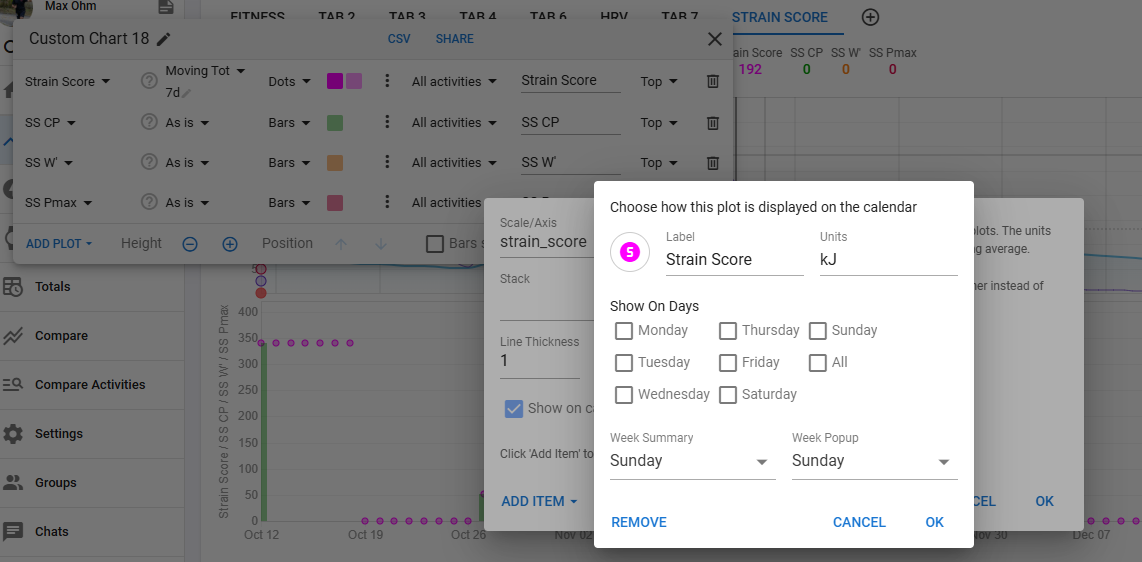
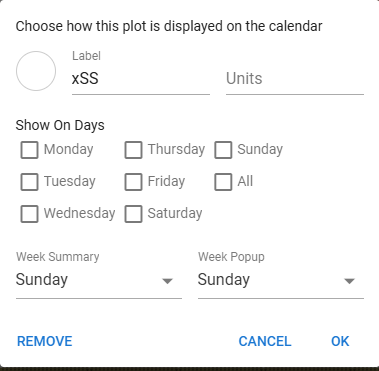
First I thought it was working but actually not… If you use “As Is” then on the Weekly Totals, it will display the XSS value of the activity made on Sunday, not the sum of all XSS values of all activities in that week… I had to change the setting of the plot, to show as “Moving Total” and Last 7d.
Happy to receive comments if this is not proper set up, I’m a beginner to customizing Intervals
Guys, you are absolutely amazing. So much help within 24hours. Thanks to you I managed to do EXACTLY what I wanted and without your help/ideas for sure I wouldn’t manage to do so.
For people that would check this topic in the future.
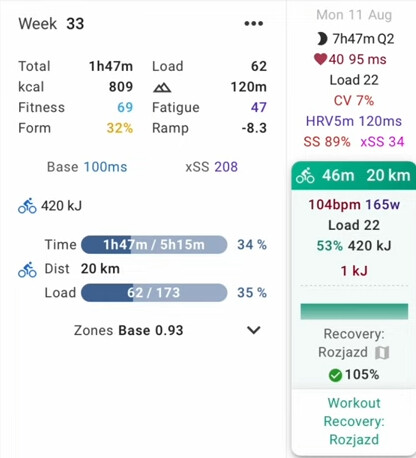
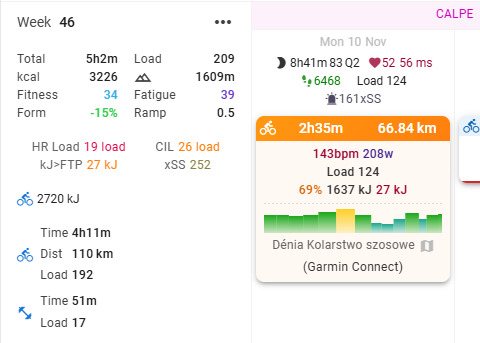
This is how my weekly calendar looks like now:
I still struggle on my end. Note that I do only running (road and trails). Could you summarize the additional metrics you display on calendar (totals and activity details), compared to defaults, and what benefits / use you make from them?
Right now I monitor load mainly using Final Surge (total elapsed time of run activities for the week, and total distance/elevation), and in addition, the total RSS load in Stryd.
But I’d like to explore how Intervals is evaluating load. I also see some load indicators in Strava, but numbers look slightly different.
Hey! I am not sure if this question was directed to me, but I am more than happy to answer and try to help you.
I’d like to explore how Intervals is evaluating load - 100 LOAD is 1 HOUR at 1 HOUR MAX EFFORT effort (i.e. 1.0 IF), so for example 100 LOAD is also 2 HOURS at 50% of 1 HOUR MAX effort.
Could you summarize the additional metrics you display on calendar (totals and activity details), compared to defaults, and what benefits / use you make from them?
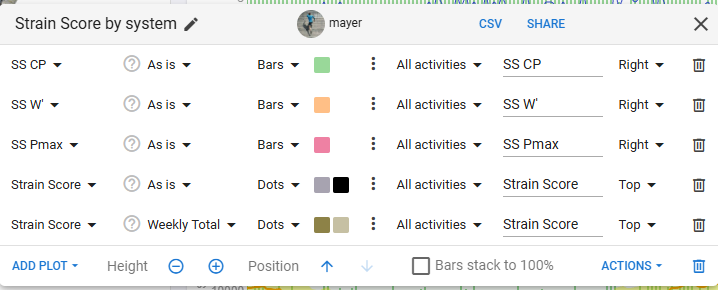
I) activity details as screenshoted:
143bpm - average heart rate during activity
208W - average power
Load 124 - load generated by activity
I believe these 3 above do not need any explanation
69% - intensity factor - summarized IF for activity. The intensity of a ride is a measure of how hard it was compared to your FTP. It is calculated by dividing the normalized watts or weighted average power for the ride by your FTP. If you are able to complete a ride of 1 hour or longer at more than 100% intensity then your FTP is too low. For activities without power intensity is derived from the training load and duration.
1637 kJ - total usage of energy
27 kJ - usage of energy done above FTP - shows how much time/effort I have done above FTP which is much more demanding than riding at or below FTP.
II) weekly totals
total time, total load, total kcal, total elevation - do not need explanation i believe
fitness - this is calculated by intervals and is basically a chronic load over last few weeks
fatigue - chronic fatigue (will increase and decrease much faster than fitness)
form - fitness minus fatigue
HR Load - Intervals.icu can estimate training load for activities without power data by using previous activities with power and heart rate data. Either the time in each HR zone or the average HR for each activity is used. This works well for cycling but does not generalize well to other sports. For running and other sports HRSS works better. This is [TRIMP] normalized to more closely match power based training load. You need to capture your resting HR for HRSS.
CIL - is a 42 day exponentially weighted moving average of the intensity for each activity. It is similar to fitness but removes the weighting for duration. It is a useful measure to look at when you are trying to reduce volume and maintain or increase intensity
kJ>FTP - explained above
xSS - is load but calculated like xert would do. Basically load calculated by intervals very much underestimates riding in Zone 2, and xSS helps a little bit with analyzing what happened. We could talk about xSS hor hours so I advice you to just watch some youtube videos about it.
I am not sure if this is what you expected so feel free to ask further questions.