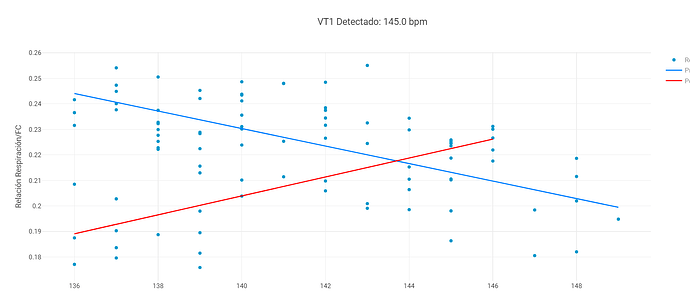
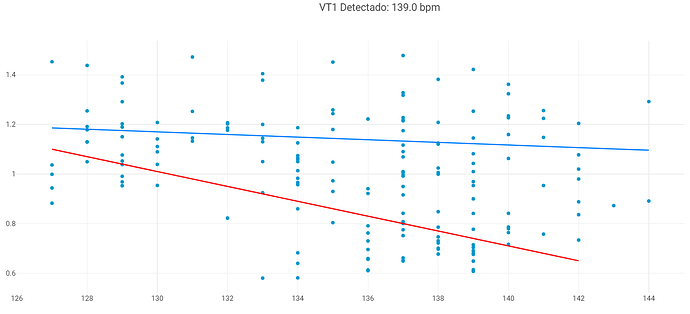
If you don’t mind adding me as a trainer that I can check, it’s strange those dips and rises, I would have to check those variations a bit. Thanks
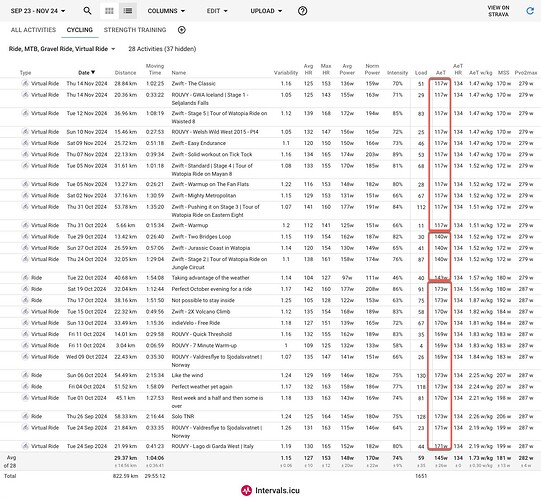
My power at AET dropped yesterday by 14 watts, but my AeTHR remains very constant at 146 bpm. Also, my MSS has dropped 7 watts. All were pretty constant over the last 4-6 weeks of 15hour training weeks. If you want deep-dive it, I can give you coach access too?
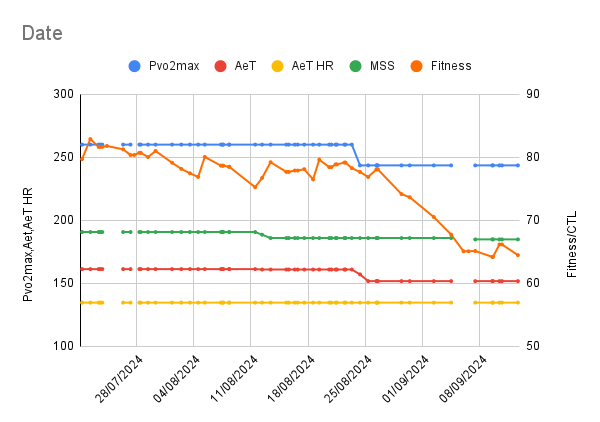
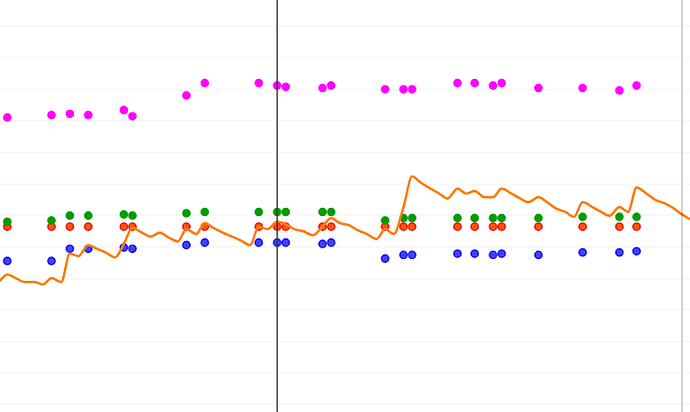
I went back 6 months and extracted the new data to see how it changed over time and showed it against my CTL.
All the numbers are about where I would have expected them except perhaps PVo2max which seems a bit low as I’d done the Kolie Moore ftp test which came out at 225W with a TTE of 42 minutes
@Luisma_Gallego_Soy_P Is this the sort of feedback you are looking for?
Out of curiosity, can you elaborate a little the difference between eFTP and MSS?
Can you post a picture of your setting?! I don’t get your point of view. ![]()
Or is the view not from Intervals?
Its an excel or google sheets chart…not from intervals.
Thank you
I downloaded a CSV file from the activities list view showing the fields I’ve plotted, then imported it into Google sheets and created a chart. They may be a way of obtaining it in Intervals.
Thanks for the chart, very valuable, see how it responds to fitness loss.
If the best way to train your Art is to ride a lot at or below it, is the best way to train MSS to do intervals at or slightly below MSS ?
mss what you are looking for is a stable state (for me ftp is not a stable state) working in the range of mss ±20w should be able to increase this value, several athletes of mine in long distance competitions have worked very well at this intensity, even in fatigue giving excellent results. It is similar to Coggan’s sweet spot but with some modifications.
are these custom fields still available? all i see are copies:
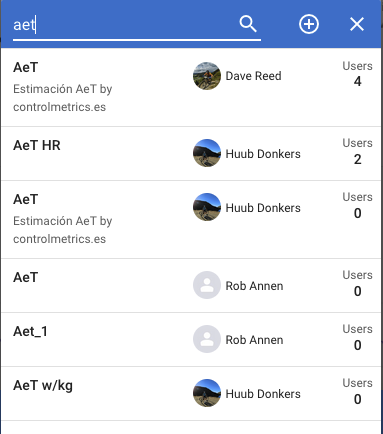
Due to the problems it caused I have removed it to avoid problems.
Are you still looking for feedback on this?
Hi, I’m new to this and am trying to understand why my AET dropped so dramatically. What should I be looking at to understand this? Was there some change in the calculations?
Thanks,
Andrij
From what @Luisma_Gallego_Soy_P said above, he removed his chart because of problems. Appears other charts that are currently shown are copies. It was always a test he was running of some software he was involved in(?). From what I read of responses there appeared to be incompatible results of cyclists’ AeT.
Yeah, no, AeT doesn’t vary as shown in your chart.
AeT is evidently very hard to measure. All references I see always say accurate results require the laboratory test. Not so with other measures.
Zones are needed. Our bodies’ response to exercise varies from day to day. In the same way I would not use 105% of FTP, even though it is very easy to measure if we use the same method, as a target of a threshold workout, commonly accepted as the upper limit, I wouldn’t rely upon trying to tune my workouts to a specific power derived from AeT. In addition the two AeT points are on a curve and there is no start and stop from one zone to another, more of a blend. It represents the mathematical center of its own zone. If we want to monitor progress there are many more accurate, easily obtained, and informative ways to measure our fitness over different HR and Power profiles.
In other words it’s no great loss that we don’t have that number. It’s extraneous information. Fun to play with but ultimately not going to impact training in a meaningful way. Imo.
Ah, understood, @Jcmiii. Thanks.
So the AeTHR, MSS, and PVo2Max fields are invalid as well, I take it?
FYI, I still see those field in the column selector. I can uncheck them, but they still appear in the list of selectable fields.
One of the reasons I removed it is for the same reason you are saying, as many of you do not understand that this was estimated through the power curve. If the power curve is not sufficiently updated, the value does not work; if in 42 days you did not have the curve updated correctly, the value decreases. But this is the same as the FTP modeling; if the curve is updated, it works quite well. I think this is what you do not understand. There is no software behind this; I don’t know what you base your assertion on. Knowing the threshold value is very important; I also don’t know what you base that on. As for working by zones, it is the biggest deception in the cycling world. How do you establish the zones? What method do you use? There are several ways to establish zones, so it simply does not work. If you use zones to prescribe training, I think you do not understand how physiology works. Of course, I have been adjusting it considering the possible errors of the power curve, but that is for me to handle.
![]()


