Hello ,
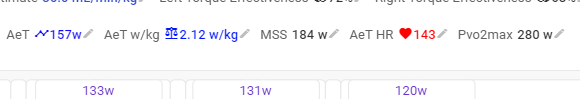
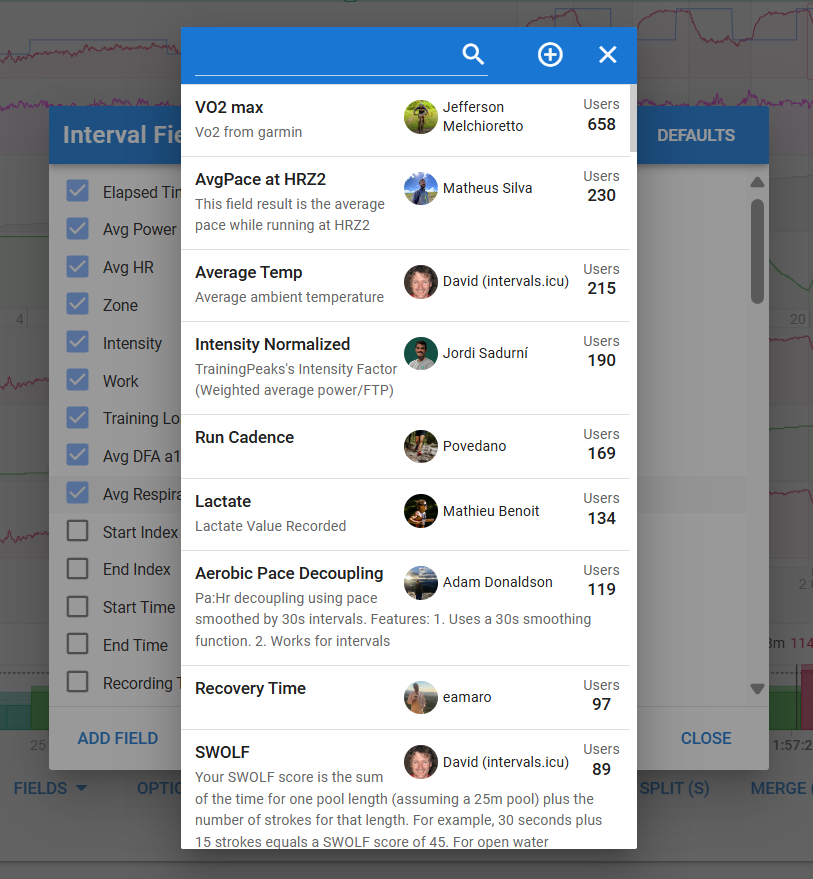
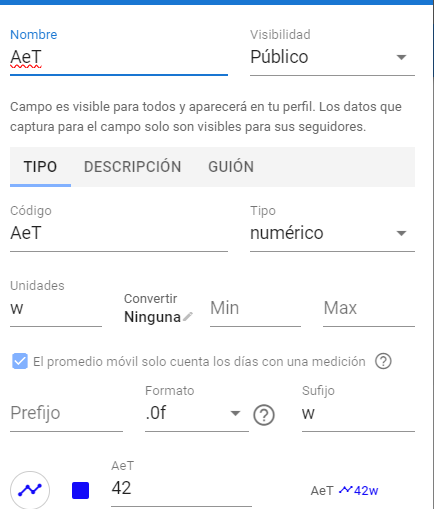
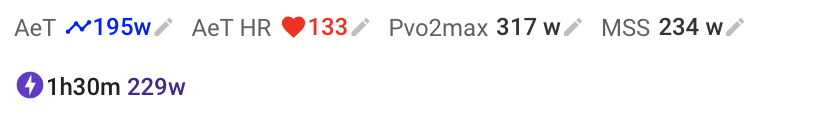
I have created some custom fields called AeT (Estimated First Threshold), AeT HR (Estimated First Threshold in heart rate), MSS (we could consider it a steady state below eFTP) and PVo2max (estimated power at Vo2max). We are testing these fields in order to be able to adjust the calculation algorithm. As with all modelling, if it does not have quality data it will decline, right now it is calculated at 30 days and another important thing is to have a good power curve, at the moment it does not use dfa or rra1 although we are also working on it with a different detection system, which at the moment seems to estimate quite well without the need to do a test (with a simple group output where we do intensity we can make an approximation).
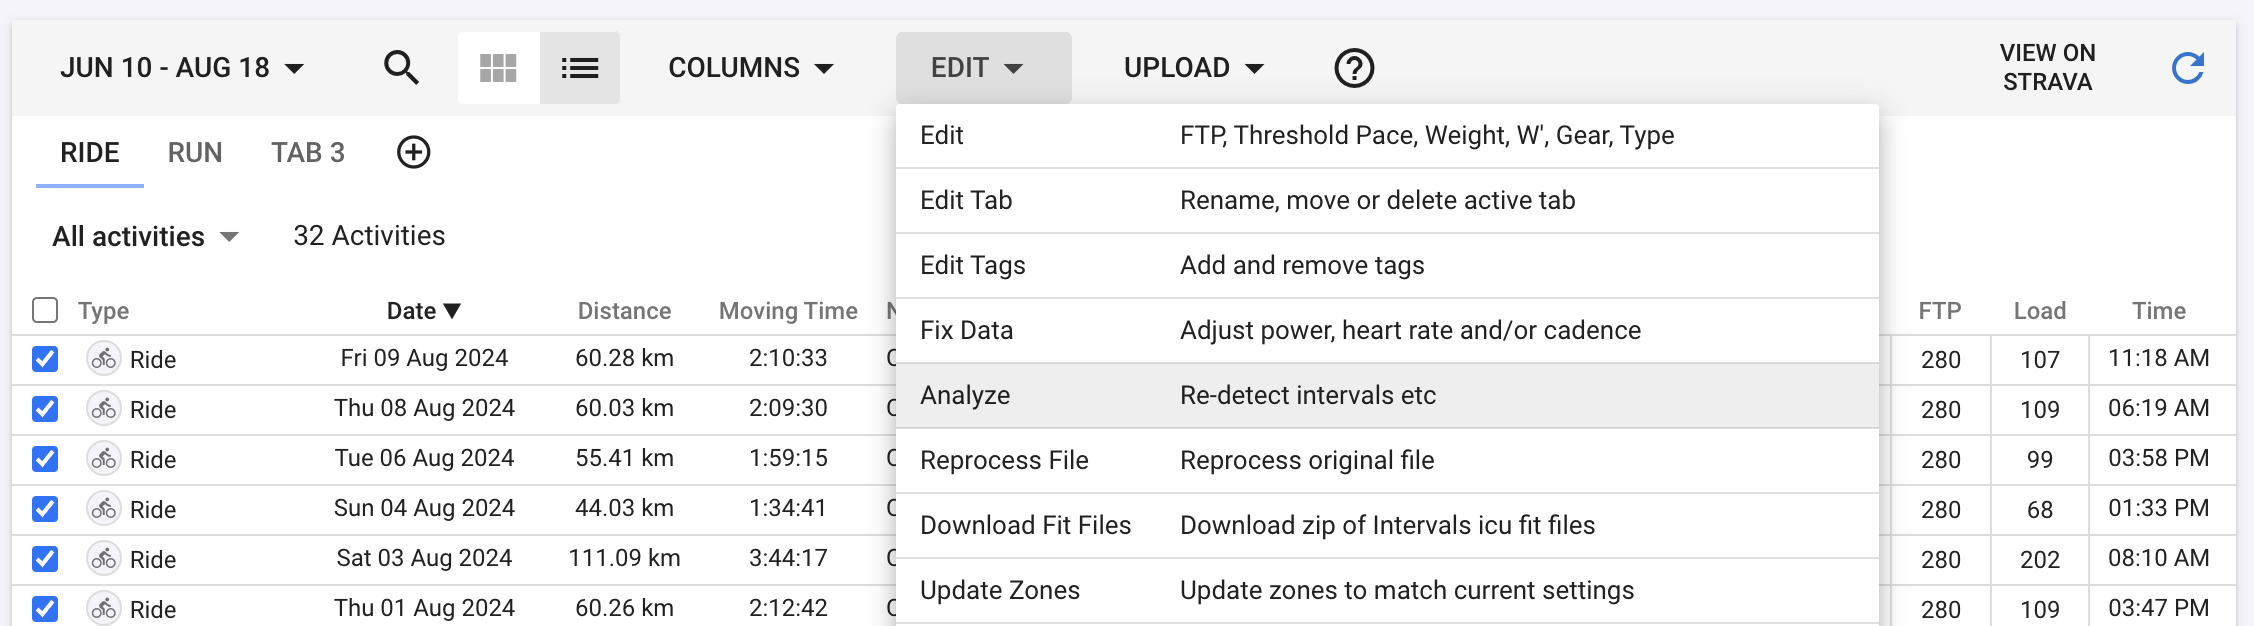
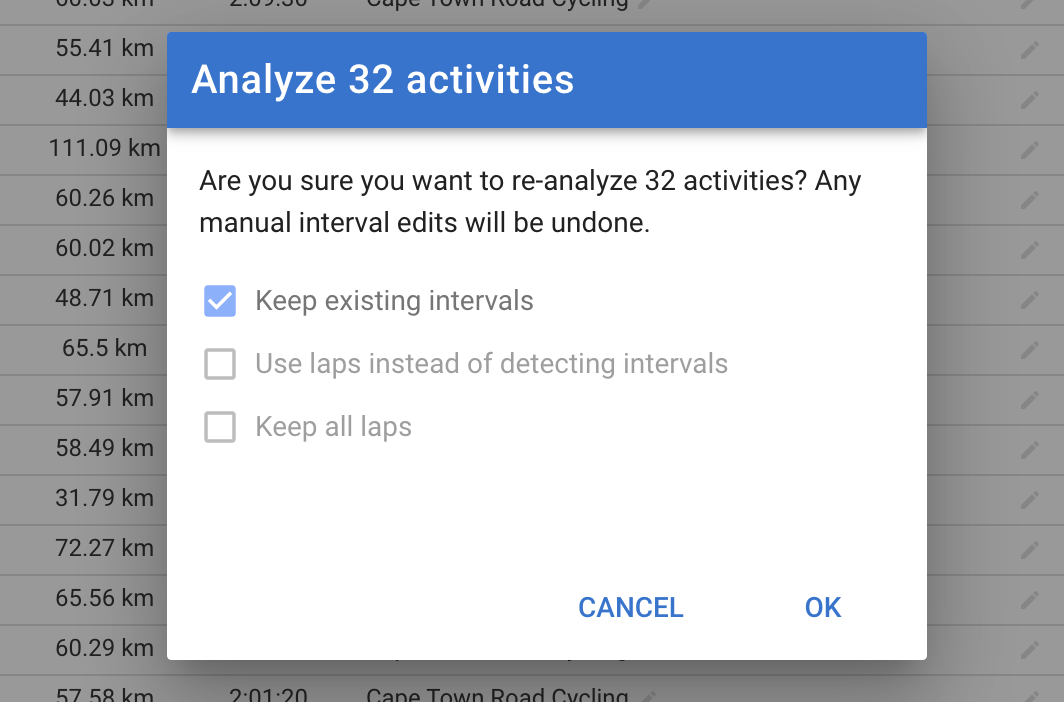
If you don’t mind I would like you to try it and let me know in this thread, of course you can plot the data over time. Remember that you would have to reprocess the activities so that it comes out where you want.
IMPORTANT: It only works with cycling data, I don’t know if it will be necessary to adjust the script so that it only acquires data from cycling and not from other sport, if you see a strange data and you have running power data, comment it too.
Thanks to @david for his quick cooperation on a request I made.
Re the ‘good power curve’ - I won’t have any races or sprints for 10s power etc. VO2 Max sessions are as intense as it’s going to get for me now. Will that skew results?
It doesn’t alter anything, when I refer to having the power curve as updated as possible is that there are no big differences between mmp and the modelling, even so it is not a big problem, train according to your plan.
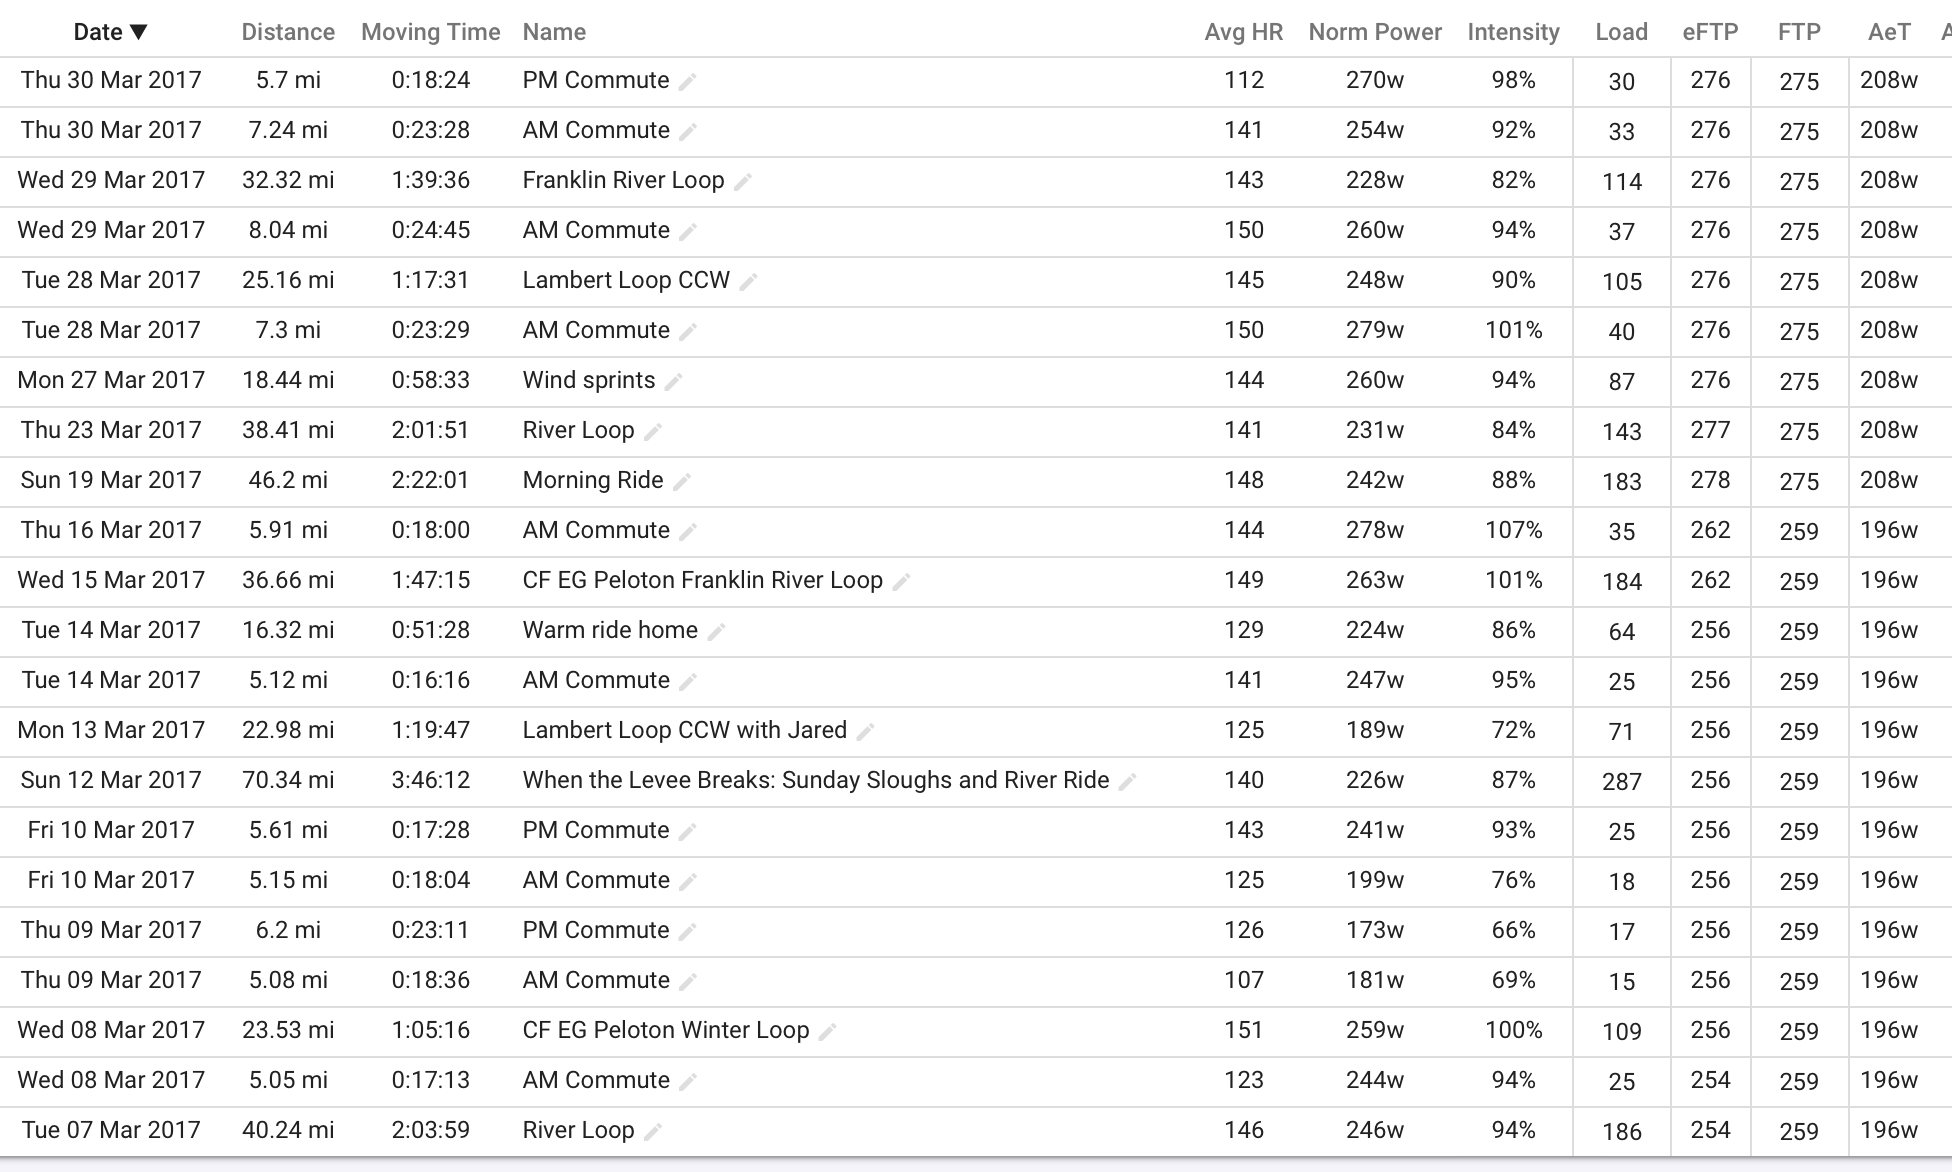
@Luisma_Gallego_Soy_P thank you for posting. Looking at my data since 2017, I’m happy with estimates of AeT and AeT HR.
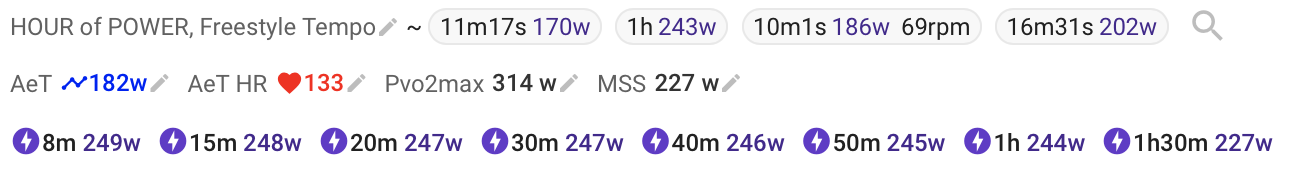
For example on steady endurance rides, I feel a change in breathing around 135-137bpm. Your AeT HR estimate is 133bpm across all years. The power at AeT also agrees with my self-estimated based on change in breathing.
PVO2max appears to be high. For example during a period of very good long and short power data, the PVO2max estimate is 351-354W. My meanmax curve at 351-354W is 150-160 seconds (0:02:30-0:02:40). WKO5 estimates for PVO2max was 335W.
Regarding MSS, I don’t know what you are estimating. You said “we could consider it a steady state below eFTP” which is open to interpretation. However I wanted to provide some data showing eMSS being roughly 50-120 minute power (depending on muscular endurance fitness)
The AeT numbers look pretty good to me! Analysed my last year or so of data. I have some work to do before the summer races start here.
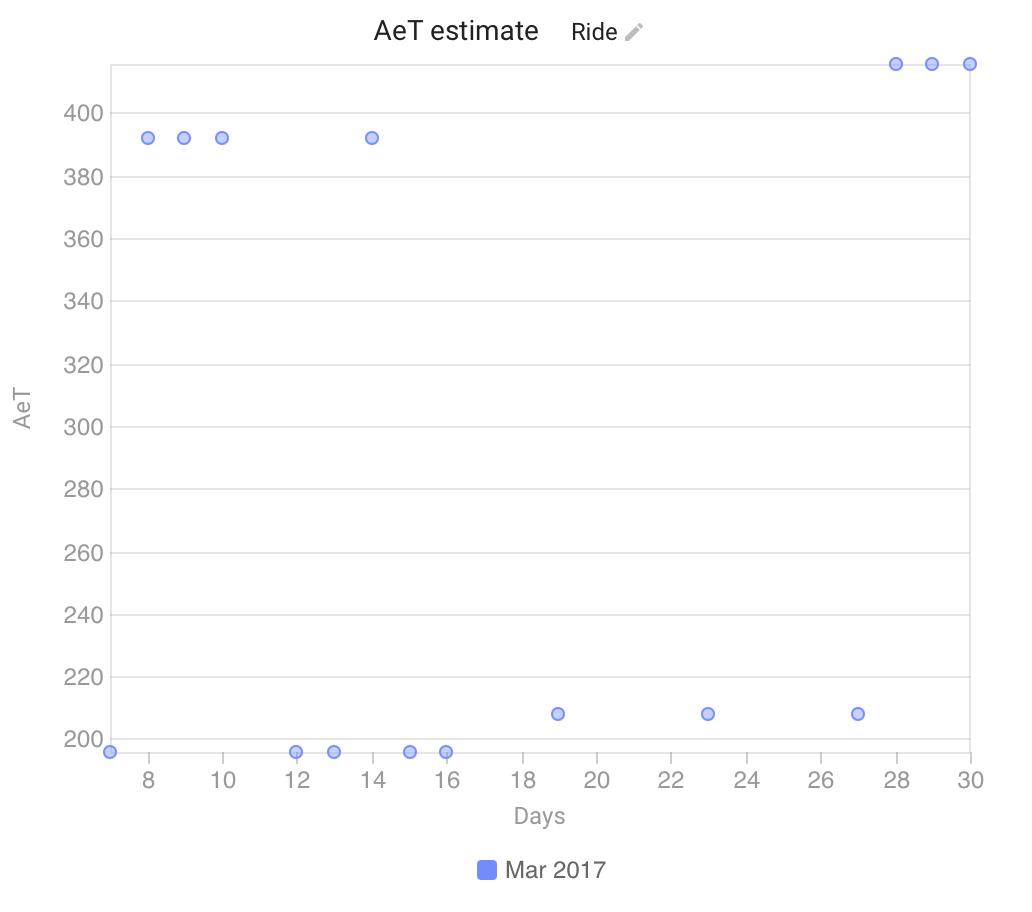
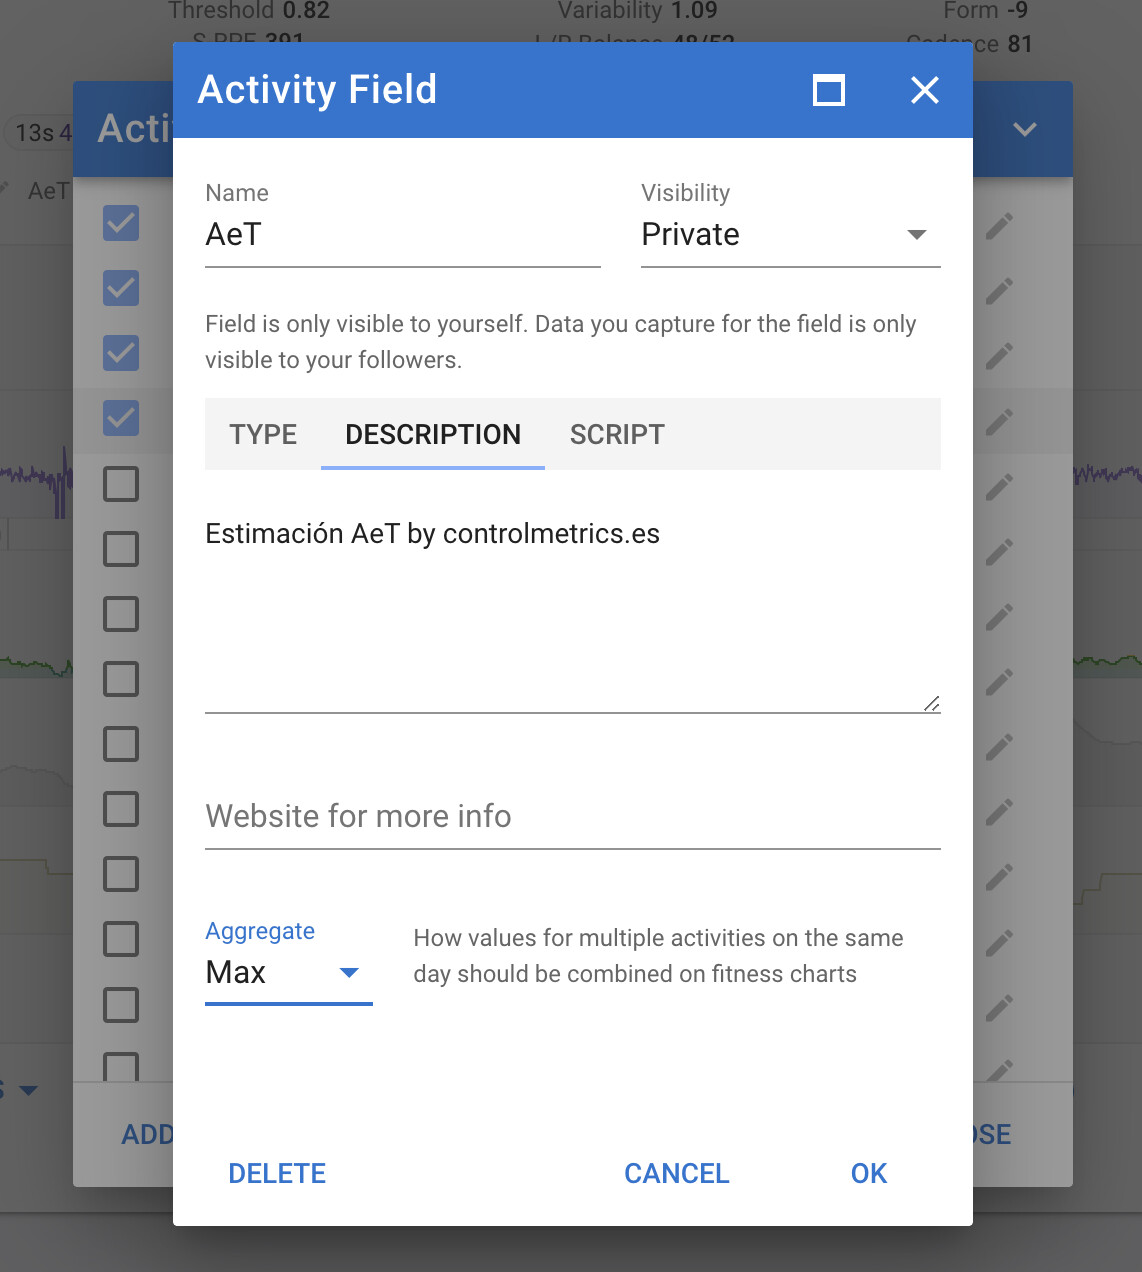
Those are probably days with multiple rides. You need to edit the fields and change the aggregate to “Max” instead of “Sum”. @Luisma_Gallego_Soy_P You can change the original fields for future users.