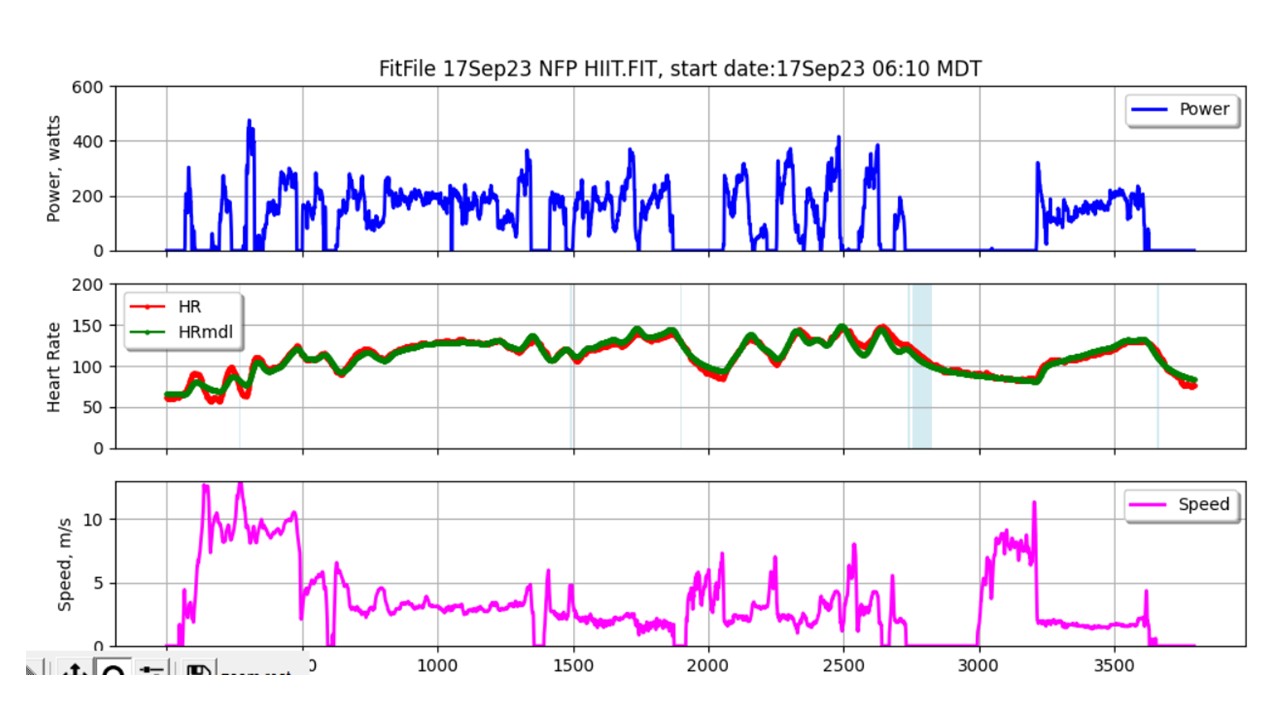
I have been working on a model of the physiological response to cycling exercise over the last few years. This model differs from analysis of wattage-only data in that it uses the heart rate data in addition. This means to use the model you must have both a heart rate and a wattage sensor during your cycling. The model uses the data in the .fit file to analyze the Heart rate along with the wattage to come up with a heart rate response template (HRRT). Using that template I can simulate an exercise test to determine VO2 Max, similar to what we would do in the clinical laboratory. Here is an example data file from a 12 mile ride through our ocal county park, which is quite hilly. Top graph shows wattage against time. You can see spikes from short sprints up a hill and Constant Efforts of longer hills Interspersed with Periods of 0 watts. Most of those are coasting downhill. At about 2200 secondsYou can see four wattage spikes from HIIT efforts, Followed by a 0 Watt coast down the long hill and a final uphill effort home.
The middle graph here shows the heart rate response to the changes in wattage in the upper graph. The red line is the actual heart rate And the green line is the fit to the model Which I think you can see is pretty good. The bottom graph is just speed which is not used in the model.
The graph below shows the simulated VO2max trial using the HRRT. Typically to determine VO2max we start at a very low wattage and every two minutes increment that wattage by a certain amount until the subject reaches their maximum heart rate or simply can’t turn the pedals anymore. To do the model I simply cut off the trial at An indicated maximal heart rate, 157.
From this simulation we get the maximum wattage attained at maximal heart rate and the slope of the changes in heart rate versus wattage (right graph). Now to get VO2 Max wel can use equations that relate wattage to VO2. I am using the equation published by the American College of sports medicine,
VO2=3.5 + 3.5 ml/kg/min + 1.8 * watts/0.163/BM, where BM is body mass, 70 in this case. Plugging in 300 watts, we get 54 ml/kg/min.
The three numbers we get from this simulation (Max Watts, VO2max and slope of Watts/HR) are indicative of fitness level.
This model can be run after every ride where you have a wattage sensor and a heart rate monitor. The following graph is my trend plot of my VO2 Max over the last couple of years. You can see gaps in the winter. You can also see a drop in my VO2max in the spring of 2022 As I was bothered by a deteriorating hip which was replaced in early September. My VO2max then recovered the following spring and summer.
Info: In the indoor cycling software of icTrainer you can see on the right side already during the workout in which ranges (related to watt and heart rate) you are training.
Some times I have high power at low heart rate (eg., early in the ride) and other times I have low power at high heart rate (eg., after I’ve cracked). How does your vo2max estimate deal with those situations?
Not currently. It is implemented as a Python application that reads .fit files and analyzes them. It is a pretty intensive routine, takes about 30sec-60sec to get a solution.
What you are seeing is that HR takes time to respond, usually 60 sec, but up to two minutes to reach close to a steady plateau after a sudden and sustained change in watts. Easy to see on an indoor trainer (see response from @Nicolino, above), but harder to do on the road. Engineers would say that HR is a low-pass filter of watts. So this is basically what my routine does, though the ‘filter’ in this case is pretty complex.
This is very interesting and would enjoy its aspect as a “eVO2Max” estimate to compare with testing. As an engineer I appreciate the low pass filter analogy. To me one of the interesting challenges of this model would be the min time effort needed to establish reasonable VO2 estimate especially if model 1tau time constant was tens of seconds. (assuming one factor exponential model and 3tau ~99% of final value)
Thanks for the comment @Bobby_Compton. I agree it might be a useful addition to other analysis, I like your ‘eVO2max’. I have only tested myself and a few fitter friends with the algorithm, so it is not thoroughly tested. I definitely would like to connect with someone with access to traditional fitness testing lab to more thoroughly validate the model. For instance, I do not know the minimum time needed to get an good reading. I imagine that would be at least 20-30 minutes, way more than just 1 time constant (though see further comment below about ‘Tau’). I do know that the model likes variations, it does not do well, for instance, on either a long stead-state ride (e.g. indoors) or a ‘ramp’ increase in wattage with no intervening periods of reduced wattage or coasting. Other than limitations like that (and there could be more…), the beauty of the routine is that it does not require a prescribed protocol – it fits whatever you do on the road. As for your comment about Tau, the underlying model is more complex than first-order filter.
@Bobby_Compton, Comment about your ‘eVO2max’; EVERY time you see VO2max as a parameter or measure of fitness on sites like Garmin, TrainingPeaks or intervals.icu, it is an ‘eVO2max’. The ONLY way to get true VO2max is in the lab, subject fitted with flowmeter and gas analysis equipment to measure metabolic response to a prescribed protocol such as an incremental or ramp test to the subjects maximum. All other estimates are just that, estimates. They should ALL indicate they are estimates. And to be even more pedantic about it in the Physiology literature there is the notion of VO2peak versus VO2max. VO2peak occurs when you don’t attain strict criteria that would qualify the test as being maximal, which can occur fairly often in patient testing as opposed to athletes.